Spatial Distribution Effect of Eco-Hydrological Indicators on Water Resources Flow for the Conservation Planning in Eastern Sudan
Abstract
This study aims to model and combine the eco-hydrological components to evaluate its impact on the potential water flow of selected catchment in eastern Sudan. Spatial variability of landcover types and magnitudes was assessed using landsat and sentinel 2 imageries for years 1996, 2011 and 2018, topographic and soil type factors were used to assess the potentiality for runoff at sub catchment level using CN approach. Rainfall records, CN map and one gauge readings for stream discharge were used to simulate the hydrograph using 10 years return period and assess volumetric flow at sub-catchment level.
Evaluation of the potentiality of the area for high runoff and prediction of water quantity produced by the catchment is crucial for dry lands in Africa generally and in Sudan. Land cover changes show the dominance of agricultural lands and reduction in natural vegetation through the studied periods in addition to soil and topography factors, curve number was generated and reflect high potentiality for generating runoff. Hydrograph analysis was generated and the runoff peak by means of volume and time during the storm event was generated. The studies demonstrate this approach that could be used for promising areas for water management and planning purposes.
Keywords
Landcover • Ecohydrology • Catchment • Remote sensing • Climate change
INTRODUCTION
Climate warming observed over the past several decades is consistently associated with changes in a number of hydrological systems components such as precipitation patterns, intensity and extremes, changes in soil temperature, moisture and runoff [1]. The significant natural variability on inter annual to decadal time is one of the attributed variables of hydrological changes therefore the anthropogenic non-climatic variables becomes more important and play crucial role locally and globally [2].
FAO (2012) stated that land cover is the most important element for description and study of the environment it detects the human interventions that affect the terrestrial ecosystem productivity and it is used as reference for many applications due to its database content that differentiates types, intensity and composition of the land [3].
In dry lands where the ecological reconstructing processes alter due to harsh environment and climate change scenario, remote sensing techniques applied to monitor the land cover change is enhancing the timely information needed to reduce the impact of land cover change over time and space, that is subjected to social, economic and environmental circumstances triggered the ecological system [4].
The land cover is a key factor in hydrological modeling, its impact is extended from water quality to its quantity and runoff ,therefore, it is an essential parameter for runoff at catchment scale that represent major interest to water resources planners, managers and decision makers [5]. According to land cover change affects hydrologic response at a range of scales. It alters both the balance between rainfall and evaporation and the runoff response of the area and modifies patterns and rates of water flow by determining the characteristics of runoff processes [6].It influences the runoff by increasing its speed and amount in addition to decreasing percolation rate [7]. Also it reflects the land effect of land use practices on water runoff and flow charge [8].
Many researches reveal that LU/LC changes in arid areas particularly woodland removal implies less infiltration due to a decrease in soil permeability, less interception of rainfall by the tree canopies and thus more runoff and high flow peaks [9].
Ecohydrology is the science that links ecosystem with hydrological cycle and interrelations of two systems [10]. One of the most important relations are the plant water dynamics and the impact of change on the water quantity, in particular where arid and semiarid environment exist due to water scarcity [11]. The effect of afforestation of grasslands and shrub lands can result in a loss of one-third to three-quarters of stream flow, or 35% to 70% in the arid and semi-arid areas of the Loess Plateau inter variable and unpredictable behavior of rainfall [12]. Impacts of LU/LC deteriorations that increase runoff and stream flow dynamic was reported by many researches [13].
According to FAO (2012) the dominated type of land cover in Sudan is Herbaceous Closed to sparse (HCO) followed by Agricultural Lands (AG) [14]. For woody cover, Shrubs Closed to sparse (SCO) is greater than Trees Close to sparse (TCO) [15].
In these arid and semi-arid regions, hydrologic systems are commonly subjected to sporadic storms that vary greatly in time and space, analyzed the records for rainfall stations between 1995-2014 in Gedarif states they stated that average difference was found for total rainfall and high coefficient of variability [16]. Surface runoff is often the dominant runoff process due to high rainfall intensities, steep slope, closeness to urban areas and sparse vegetation factors [17]. One of the main streams was studied due to its high response to rainfall it produced high runoff volumes that affected Gedaref major town and its surroundings within one day or less [18]. Therefore, understanding the stream flow regime, relationship between rainfall and runoff and other factors becomes of great importance for water yield. This research was conducted to support the efficient water use by complementary approach for different eco-hydrological factors to fill the gap of lacking continuous hydrologic data that are needed for flow characteristics of the watershed at sub basin levels and reflect the importance of runoff potential areas for water management [19].
The studied area
Gedarif state is considered as the first state in rainfed agriculture of economic crops like sesame, it is considered as an important area for water management planning because many streams cross this area from the east Ethiopian plateau to diverse directions across the Sudanese lands. The studied area is located between longitudes 33°30’ and 36°30’ to the East, and latitudes 12° 40’ and 15°46’ to the North, the total area of Gedarif state is 71,000 km². Over two-thirds of the population lives in rural areas and population density on a state-wide basis stands at around 19 persons per km², the majority of the state receives between 500 mm-900 mm of rainfall annually. Annual average precipitation varies greatly in Sudan, in Gedarif state the coefficient of variation of annually total rainfall is range between 29%-49% and inter annually is ranged 137-260, august is the month with the highest precipitation rates in Sudan; however, the biggest decreasing trend also occurred in this month That rain support the cultivation of large areas and the growth of valuable forestry and grassland outside of the rainy season, However, it suffers from water scarcity and conflicts have been known to escalate over access to water points (Figure 1).

Figure 1. Location of the catchment. Note:

Physical setting of the watershed
The water shed flows from east to west. Its elevation varies from 614 m-434 m above mean sea level. The shape of a watershed influences the shape of its characteristic hydrograph, U shaped watershed presents a lower concentration time and generates higher flow. The total catchment area is 5,504 km2, it is fed by many attributes and the length of main course is 117 km.
The soil characteristics
Soils has dark colors, a high clay content and strong vitriolic properties including a large, rather uniform, clay plain intersected by streams. The clay content is very high and generally 75% to 80%. The organic matter and nitrogen content of the soil are low but as there is no deficiency of other plant nutrients, the soil is moderately fertile. The water holding capacity of the soil material is very high. This, in combination with the deep penetration of water in the soil through the vertisolic cracks, causes the available water holding capacity of the soil to be very high. This high water holding capacity allows crops to grow on stored water during dry spells and long after the rainy season. The soil also has undesirable physical characteristics, such as a low permeability when wet, causing the soil to be waterlogged for certain periods during the rainy season and flooding occurs which may lead to severe crop damage. Also, the soil is difficult to cultivate as it is very hard when dry and very sticky and plastic when wet, causing the moisture range at which the soil can be cultivated to be very narrow.
Materials and Methods
The method used was a multi-disciplinary approach that integrated many eco hydrological components as land cover, soil, topography and rainfall to assess the potential runoff and simulate the flow using limited discharge readings.
Land cover classification and change detection
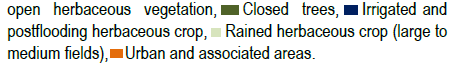
The landsat satellite images (30 m) for the year 1996 and 2011 and sentinel 2 satellite image (10 m) for year 2017 were acquired and used as a primary source of information, they were classified according to land cover classification system that classifies the land into two major landcover types, cultivated and managed terrestrial areas and natural and semi-natural terrestrial vegetation that considered the map-ability of the targeted area and the environmental attributes that influence the land cover. The classification results for the year 2018 were validated by field check for an ambiguous area, the change was detected in magnitude and type.
The land cover classes were rated for the purposes of their influence on runoff speed and water infiltration of the soil (Table 1).
| Code | Land cover type |
|---|---|
| AG | Agriculture in terrestrial and aquatic/regularly flooded land |
| HCO | Herbaceous closed to sparse in terrestrial and aquatic/regularly flooded land |
| SCO | Shrubs closed to sparse in terrestrial and aquatic/regularly flooded land |
| TCO | Trees closed to very open in terrestrial and aquatic/regularly flooded land |
| URB | Urban areas |
| WAT | Seasonal/perennial, natural/(artificial) Water bodies |
Digital elevation model
DEM from shuttle radar topography mission (30 m) was used for hydrological modeling to detect the topography, the highest elevations is 772 m in the north east of the catchment and the lowest elevations is 389 m in the south west. Runoff of the monthly rainfall for the study area was obtained from the only one available rain gauge reading (Figure 2).

Figure 2. Digital elevation model for catchment area. Note: 

Soil map
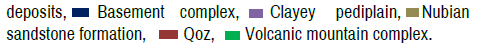
Developed soil map based on that of the using sentinel 2 satellite 10-meter resolution distinguished clearly soil unites for this research. The main characteristic is basement complex dominating the state adjacent to a high clay content soil to the east. Generally the clay plains intersected by small valleys. The soil map of the studied area was classified according to its hydrological properties and its infiltration rate as presented and recommended by US soil conservation service (Figure 3 and Table 2).

Figure 3. Gedarif state soil map. 
| Group | Description |
|---|---|
| A | Soils with low runoff potential due to high infiltration rates, even when thoroughly wetted. |
| B | Soils with moderately low runoff potential due to moderate infiltration rates when thoroughly wetted. |
| C | Soils with moderately to high runoff potential due to slow infiltration rates when thoroughly wetted. |
| D | Soils with high runoff potential due to very slow infiltration rates. These soils consist primarily of clays with high swelling potential |
Rainfall
Rainfall records for the 64 years (1941-2005) were used for investigating the hydrological characteristics of the study area. Generally in Sudan rain events take place during the rainy season, which extends from July-September. By analyzing these data the maximum daily rainfall for this period was found to be 450 mm. Rainfall of the area is of high variability and it fluctuates up and down the mean, the departure from the mean is high. Show the rainfall variability (Figure 4).

Figure 4. The Variation of the annual maximum rainfall.
Hydrological model
The Soil Conservation Services (SCS) Curve Number method was utilized for the estimation of event runoff. The model was developed by studying overland flow in many small experimental catchments and it is one of the most widely used methods to compute direct storm runoff.
CN represents the runoff volumetric potential of the land cover-soil complex governed by soil property, cover type and hydrologic condition of the land surface as demonstrated. CN was generated from modeling of land cover map, soil map, and topography in GIS environment. Season average peak discharge was used to generate the hydrograph for the basins along the stream.
The time difference between the centered of the effective rainfall and the maximum runoff is commonly called the time lag. Hydrograph was simulated by combining CN layer, time lag data and sub basin areas, junctions and rainfall data. One-day time step was used for the simulation because generally the flow rate was reported in daily basis. The time of peak was generated, the curve was plotted using flow rate (volume/mm) versus time. Return period of 10 years was used to simulate the storm effect on peak runoff rate.
Results
The Land cover change in Gedarif state was characterized by expansion of agricultural areas (1.7%), the woody vegetation is declined in the centre of study area where the catchment of majored stream is located. The woody vegetation (shrubs and trees) are facing wide cutting by 1366.44 ha between 1996 and 2010 where while minor decline was found between 2010 and 2017 because most of the areas was converted to agriculture during the past period. The urban areas were grow and expense of natural woody vegetation is dominant, reflect the trend of land cover change classes (Figures 5-8) (Table 3).

Figure 5. Land cover map of year 1996.


Figure 6. Land cover map of year 2010.


Figure 7. Land cover map of year 2017.


Figure 8. The land cover of the catchment.
| L. cover type | Area (1996) km2 | Area (2010) km2 | Ch.% (1996-2010) | Area (2017) km2 | Ch.% (2010-2017) | Ch./area |
|---|---|---|---|---|---|---|
| AG | 24486.66 | 34895.71 | 42.5 | 38230.99 | 56.1 | 13744.33 |
| BS | 29.86 | 189.98 | 536 | 590.39 | 95 | 560.53 |
| HCO | 25752.58 | 14302.18 | -44.4 | 12243.13 | -52.4 | -13509.5 |
| SCO | 3098.9 | 2078.3 | -32.9 | 2070.25 | -33.1 | -1028.65 |
| TCO | 6015.36 | 5369.52 | -10.7 | 4623.65 | -23.1 | -1391.71 |
| URB | 146.28 | 401.14 | 174 | 418.76 | 186 | 272.48 |
| WAT | 45.45 | 1242.27 | 263 | 1402.08 | 298 | 1356.63 |
According to soil hydrological criteria for catchment area, it was found that dominant soil type is basement complex that has shallow soils pediment non-bearing basal rocks in its geological formation and it classified as group but in the eastern part soil have more clay content and classified as D group. The study area is characterized by gentle slope towards the entire watershed. the slope steepness play a crucial role in depicting areas of perfect runoff, thus steep sloping areas have high runoff potentials generated from DEM as Figure 9.

Figure 9. Soil hydrological group basement complex and clay
Hydrological analysis
The Soil Conservation Services (SCS) Curve Number (CN) model estimated is give an indication of area that have a potential to generate more runoff based on generated factors. High CN values found in the landcover type of rainfed crops like seaseme and sorghum and dominated by soil hydrological class C, therefore, CN was found between 87 to 85.6, located in basin 3,4,6,7 respectively, however, the CN value of basins higher (87) due to its, it is steeper topography and longest sub basin shape compared to other sub basins. The area with low CN values of 82 lie in dense land cover types consists of trees and shrubs. Generally, the watershed area considered has high CN values; the amount of CN generated for each basin is summarized in (Figures 10 and 11) (Table 4).

Figure 10. Curve number for watershed.

Figure 11. Basins map.
| Basin name | Curve number (CN) | Area (Km²) |
|---|---|---|
| BS1 | 85.3 | 1734.9 |
| BS2 | 82.5 | 1718.3 |
| BS3 | 87 | 569.73 |
| BS4 | 85.6 | 756.55 |
| BS5 | 82.6 | 133.6 |
| BS6 | 85.6 | 381.45 |
| BS7 | 85.6 | 209.62 |
Hydrograph analysis for a return period of 10 years’ results, the result indicates that significant amount of water at sub basins was produced, the maximum volume that is estimated as peak discharge was about 64852.5 (M3/S) in outlet J4 (Table 5).
| Basin/junction | Drainage area/km | Peak discharge m3/s | Time of peak | Volume/mm |
|---|---|---|---|---|
| BS1 | 173.9 | 20659.2 | 0.769444 | 279.52 |
| BS2 | 1718.3 | 18631.2 | 0.783333 | 273.77 |
| J1 | 3453.2 | 39149.8 | 0.776389 | 276.66 |
| BS3 | 569.73 | 8169 | 0.741667 | 284.43 |
| BS5 | 133.6 | 3344.7 | 0.679167 | 273.57 |
| J2 | 4156.53 | 47265 | 0.765972 | 277.63 |
| BS4 | 756.55 | 10414.4 | 0.745139 | 280.71 |
| BS6 | 381.45 | 5174.3 | 0.748611 | 281.09 |
| J3 | 5294.53 | 62394.1 | 0.759028 | 278.32 |
| BS7 | 209.62 | 3817.3 | 0.708333 | 272.83 |
| J4 | 5504.15 | 64852.5 | 0.755556 | 278.11 |
Discussion
The spatial distribution of landover type, as important ecohydrological indicator, play important role on infiltration capacity and soil porosity, both are increased by the presence of vegetation root system. Majority of studied area is covered with agricultural area that generate more run off compared to natural vegetation. The sparse scattered vegetation cover causes rapid runoff especially on undulated slopes since the surface flow take less time to infiltrate through the soil, thus the catchment area has high runoff potentials.
The analysis carried out in this research showed that land cover type of trees and shrubs was reduced by percentage ranged between 10%-32% for fourteen years’ time period and 23%-33% for seven years’ time period .Increased of agricultural lands is dominant feature in landcover type that reach to 56% in twenty years’ time period. The other eco-hydrological indicators such as soil type is essential for the infiltration capacity and the saturation point, the study showed the soil dominated the catchment area has high clay content percentage, produced low soil infiltration through time of rainfall and generate higher runoff. The elevation of the catchment and slope of sub basins are essential factors in flow direction and runoff peak values, the study found that there are some basins produce more runoff while it has the same landcover type but steeper slope. The finding of land cover changes trends, soil and topography explain the results curve number values that increase at areas of degraded vegetation cover and decreased where dense vegetation was found, this agreed with other researches in dry regions and east Africa.
Hydrograph analysis for the catchment is important for the water sector in dry lands like Sudan that facing fluctuations in rainfall and high excess rainfall. This study concluded that this catchment received significant amount of water and due to steep sub basin slopes faster runoff and more peaked hydrographs occurring earlier in time than sub basins with flatter slopes.
Possibilities of flood damage for properties and agriculture become higher in this watershed. This study is suitable for estimation of runoff from un-gauged catchments crucial for the strategic design of dams and help in planning for water-crop management in this dry region of Sudan.
Conclusion
This study indirectly contributes to the socioeconomic development of streams of Sudan providing better knowledge of Catchment area and rainfall-runoff relation for efficient utilization and management of the water resources.
Without a sustainable plan in place for managing the water resources lack of water will persisted therefore, provide water for crop irrigation in post season and maintain water supply in dry spells when rain fluctuate should take place through constructing small dams.
Storm hydrographs in this study were use 10 years for the return period. They are useful in planning for flood situations and times of drought.
This study has given some insight about the surface water potential of the study area; it could be used directly or associated with other studies for water management, urban drainage, flow forecasting, future urbanization impact, reservoir spillway design, flood damage reduction, floodplain regulation, and systems operation.
Acknowledgment
The effort and cooperation of ministry of water and irrigation and electricity for provide field work assistance, Also the cooperation of remote sensing and seismology authority of provide the landcover maps for research area are appreciated.
References
- Baldyga, Tracy J, Scott N Miller, Kenneth L Driese, and Charles Maina Gichaba, et al. "Assessing Land Cover Change in Kenya's Mau Forest Region Using Remotely Sensed Data." Afr J Ecol 46 (2008): 46-54.
- Bormann, Helge, Lutz Breuer, Thomas Graff, and Johan A, et al. "Analysing the Effects of Soil Properties Changes Associated with Land Use Changes on the Simulated Water Balance: A Comparison of Three Hydrological Catchment Models for Scenario Analysis." Ecol Model 209 (2007): 29-40.
- Brink, Andreas Bernhard, and Hugh Douglas Eva. "Monitoring 25 Years of Land Cover Change Dynamics in Africa: A Sample Based Remote Sensing Approach." App Geo 29 (2009): 501-512.
- Ellis, Edward A, Kenneth A Baerenklau, Raymundo Marcos-Martinez, and Edgar Chavez, et al. "Land Use/Land Cover Change Dynamics And Drivers in a Low-Grade Marginal Coffee Growing Region of Veracruz, Mexico." Agrofor Sys 80 (2010): 61-84.
- FAO. The Landcover Atlas of Sudan. (2012)
- Farley, Kathleen A, Esteban G Jobbagy, and Robert B Jackson. "Effects of Afforestation on Water Yield: A Global Synthesis with Implications for Policy." Global Change Biol 11 (2005): 1565-1576.
- Gao, Zhaoliang, Zhan Zhang, and Xiaoping Zhang. "Responses of Water Yield to Changes in Vegetation at a Temporal Scale." Front Fores China 4 (2009): 53-59.
- Gumindoga, W, THM Rientjes, A T Haile, and T Dube, et al. "Predicting Stream Flow for Land Cover Changes in the Upper Gilgel Abay River Basin, Ethiopia: A Topmodel Based Approach." Phys Chem Earth Parts A/B/C 76 (2014): 3-15.
- Jehad, T Hamad, A Eshtawi Tamer, M Abushaban Almotasembellah, and O Habboub Mohammed, et al. "Modeling the Impact of Land-Use Change on Water Budget of Gaza Strip." J Water Resour Prote (2012).
- Jewitt, GPW, JA Garratt, IR Calder, and L Fuller, et al. "Water Resources Planning and Modelling Tools for the Assessment of Land Use Change in the Luvuvhu Catchment, South Africa." Phys Chem Earth Parts A/B/C 29 (2004): 1233-1241.
- Jiang, Jing, and Guangjin Tian. "Analysis of the Impact of Land Use/Land Cover Change on Land Surface Temperature with Remote Sensing." Proced Environ Sci 2 (2010): 571-575.
- Hassaballah, Khalid, Yasir Mohamed, Stefan Uhlenbrook, and Khalid Biro, et al. "Analysis of Streamflow Response to Land Use and Land Cover Changes Using Satellite Data and Hydrological Modelling: Case Study of Dinder and Rahad Tributaries of the Blue Nile (Ethiopia-Sudan)." Hydro Earth Sys Sci 21 (2017): 5217-5242.
- Biro, Khalid, Biswajeet Pradhan, Manfred Buchroithner, and Franz Makeschin, et al. "Land Use/Land Cover Change Analysis and its Impact on Soil Properties in the Northern Part of Gadarif Region, Sudan." Land Degrad Develop 24 (2013): 90-102.
- Yousif, Lotfie A, Abdelrahman A Khatir, Faisal M El-Hag, and Ahmed M Abdelkarim, et al. "Rainfall Variability and its Implications for Agricultural Production in Gedarif State, Eastern Sudan." Afri J Agri Res 13 (2018): 1577-1590.
- Maidment,DR. Hand Book of Hydrology Mcgroe-Hill, Newyork (1993).
- Rodriguez‐Iturbe, Ignacio. "Ecohydrology: A Hydrologic Perspective of Climate‐Soil‐Vegetation Dynamies." Water Resour Res 36 (2000): 3-9.
- SCS. Soil Conservation Services, Hydrology Handbook Chap.4. (1972) .
- Yao, Michel K, Pascal KT Angui, Souleymane Konate, and Jerome E Tondoh, et al. "Effects of Land Use Types on Soil Organic Carbon and Nitrogen Dynamics in Mid-West Cote D’ivoire." Europ J Sci Res 40 (2010): 211-222.
- Zhang, Zengxin, Chong-Yu Xu, Majduline El-Haj El-Tahir, and Jianrong Cao, et al. "Spatial and Temporal Variation of Precipitation in Sudan and their Possible Causes During 1948-2005." Stochastic Environ Res Risk Asses 26 (2012): 429-441.
Author Info
1Department of Hydrology, Al-Neelain University, Khartoum, SudanReceived: 23-Dec-2019, Manuscript No. hycr-19-5849; Editor assigned: 26-Dec-2019, Pre QC No. P-5849; Reviewed: 09-Jan-2020, QC No. Q-5849; Revised: 03-Aug-2022, Rev Manuscript No. R-5849; Published: 31-Aug-2022, QI NUMBER: Q-5849
Citation: Babiker, Solafa, Israa Gafar and Elbasri Abu lgasim. "Spatial Distribution Effect of Eco-Hydrological Indicators on Water Resources Flow for the Conservation Planning in Eastern Sudan." Hydrol Current Res 13 (2022): 399.
Copyright: © 2022 Babiker S, et al. This is an open-access article distributed under the terms of the creative commons attribution license which permits unrestricted use, distribution and reproduction in any medium, provided the original author and source are credited.