Research - (2021) Volume 10, Issue 5
Received: 10-May-2021
Published:
30-May-2021
, DOI: 10.37421/2169-0316.2021.10.294
Citation: Aregawi Yemane, Alehegn Melesse Semegn, Ephrem
Gidey. "ABC Classification for Inventory Optimization (Case Study Family
Supermarket)." Ind Eng Manage 10 (2021): 294.
Copyright: © 2021 Aregawi Yemane, et al. This is an open-access article
distributed under the terms of the Creative Commons Attribution License, which
permits unrestricted use, distribution, and reproduction in any medium, provided
the original author and source are credited.
This article deals with comparison between traditional ABC classification (using annual usage only) and an optimal new multi criteria ABC classification (using annual usage, unit price and lead time). ABC inventory classification is a well-known approach to assign items into three basic categories as A, B, and C based on their usage volume and sales. Efficient and effective inventory management helps a firm maintain competitive advantage, especially in a time of accelerating globalization. Most of the super market managers in our country do not use any inventory control techniques to monitoring the huge amount of items in their stock. The aim of this paper is to introduce an optimal multiple-criteria ABC analysis that improves the inventory management control system. On this approach the researchers use additional criteria, such as unit price and lead time.
ABC analysis, Inventory, Multi criteria, Optimization, Super market
The multi-criteria ABC inventory classification has been widely adopted by organizations for the purpose of specifying, monitoring, and controlling inventory efficiently [1]also this article defriend as Inventory classification using ABC analysis, which is based on the Pareto principle, is one of the most widely employed inventory control techniques in practice [2].ABC analysis is a well-known inventory classification technique used to categorize a huge number of inventory items, since, in practice items cannot be managed with equal attention [3] and [4].
Today, in any industry inventory optimization is a critical issue. Excess and Shortage of inventory in all levels of thesupply chain can affect the availability of products and/or services to consumers. Several monitoring systems and processes can be employed to check inventory imbalances to minimize the supply and demand dynamics.
Companies often manage a large number of items in stock; it is difficult to give them the same level of control and monitoring due to huge amount of items in stock. For this reason the inventory managersare expected to split their stocks in several categories in order to establish priorities and specific management rules to each category. For this purpose, the ABC classification is one of the most used items segmentation methods. The ABC inventory classification problem is classification of a large amount of items into three groups: A, very important; B, moderately important; and C, relatively unimportant. This hierarchy into three classes is based on the Pareto principle.Under this approach, [5] the class A is composed of 10 to 20% of the items that are between 70 and 80 % of the value of total annual use. The articles of this class are very important and must be managed and monitored carefully. The second class B includes between 30 and 40% of all items representing 15-20 % of the value of total annual use. Control sections of this class can be a less flexible than the previous category. Finally, the class C may contain up to 50 % of items in stock, but only 5 to 10% of the value of total annual use.
Control standards and monitoring may be reduced for the last category of items. In addition, inventory managers often need to consider,simultaneo usly,manycriteriaintheclassificationofstocks such as the unit price, delivery time, the criticalityoftheitem,thenumberoforders,numberofclientsinterested by the item etc.Generally, in Ethiopia, there is no any inventory management technique practiced now days that is why we have done this research work.
Statement of the Problem
Nowadays, in any type of industry inventory optimization is a critical issue throughout the World. Different inventory control policies can be applied to different industries. The well-known ABC classification is simple-tounderstand and easy-to-use.
In Family super market often there are a large number of items in stock; it is difficult to give them the same level of control and monitoring due to huge amount of items in stock. The super market manager does not use any inventory control techniques to monitoring the huge amount of items in stock.
Research Questions
➣ What type of criteria use the inventory to classify the items and to optimize the inventory management?
➣ Which items are classifying under the A class, B class and C classification?
➣ Which items retain as and transfer to A, B and C classification in the new method compare to traditional one?
General objective
The main objective of the paper is to classify items in to different classes based on values of unit cost, annual usage and lead time. Specific objective
➣ To prioritize the variety of items depending on unit price, annual usage and lead time.
➣ To comparison between a traditional ABC classification(only annual usage) and new ABC classification (multi-criterion classification i.e. using annual usage, unit price and lead time)
➣ To introduce and to give a direction the multi-criterion ABC classification techniques for Family supermarket as well as to Ethiopian supermarkets.
The data is collected by using primary and secondary data collection methods. The method to be employed to achieve the objectives of the research is:
A survey of available published documents related to inventory management and techniques of inventory management will be undertaken. The review will cover documents related to:
➣ Inventory management
➣ Techniques of inventory control
➣ ABC classification
Different data’s like annual usage, unit cost and lead time will be recorded to different items for the purpose of ABC classification. Observe the existing lay out and develop a new one.
The proposed methodology enables the classification of inventory items via a set of common weights linear optimization model which is very essential in a fair classification. It has a remarkable computational saving when compared with the existing approaches and at the same time it needs no subjective information. Furthermore, it is easy enough to apply for managers [2]. So, the researcher would like to propose a weight linear optimization model for the MCIC problems. The mathematical formulation is presented [6]. As we stated the literature part ABC analysis is simple-to-understand and easy-touse. However, traditional ABC analysis is based on only single measurement such as annual dollar usage. It has been recognized that other criteria, such as inventory cost, part criticality, lead time, commonality, obsolescence, substitutability, number of request per year, scarcity, durability, reparability, order size requirement, stock-ability, demand distribution and stockout penalty, are also important in inventory classification. So the paper considered the annual usage, average unit cost and lead time to classify the items, the researchers preferred this method because of our case study’s data are suitable for this method. After classified the items we will be used FIFO depending on the time horizon arranging the layout of the items in Family Super Market. The steps of the methodology stated as follows:
Step 1. Consider an inventory with I items and these items are to be classified based on J criteria. The measurement of the ith item (1, 2,….,n) under the jth(annual usage, average unit cost and lead time) criteria is denoted as yij. In our model development, we firstly transform all measures to comparable base using transformation the following formula Items transformed = (Yij- min Yij {i= 1,2,…,I})/ (maxi= 1,2,….,I{Yij} – min i= 1,2,…,I{Yij})
After we transformed all items, based on their criteria we will find the partial weight (wij) of all criteria’s for each item.
To calculate the partial weight of the first item equal to the first transformed value, we can calculate all items easily as follows:
Step 2.
Pwi1= partial weight 1 for item i
Pwi2= partial weight 2 for item i
PwiJ= partial weight J transformed values for item i
Pw11 = (transformed value for item 1 and criteria 1)/ 1
Pw12 = (pw11 + (transformed value for item 1 and criteria 2))/2
Pw13 = (pw11 + pw12 + (transformed value for item 1 and criteria 3))/3
pwij =
Step 3. After calculating the partial weight of all criteria’s for each item then we will calculate the maximum score of each item. Compare and locate the maximum among these partial averages. The corresponding value is the score Si of the ith item.
Max score (Si) = max ( pwij) for each item
Step 4. Sort the scores Si’s in the descending order
Step 5. Group the inventory items by principle of ABC analysis
ABC analysis is simple-to-understand and easy-to-use. However, as we have gotten from different article literatures traditional ABC analysis is based on only single measurement (criteria) such as annual dollar usage. Some journals used multi criteria to classify the items based on annual usage dollar, average unit cost and lead time [6], [7], [2] and [8] Service level, Annual sales of stock keeping units(SKUs) [9], annual usage value (AUV), profit margin (PM), the annual number of orders (NO) and the number of clients (NC) [5], for Fertilizer Classification ABC used as an input to forecast the demand depending on lead time and sales price [10].
Thosearticles used an alternative weight linear optimization model for the multi-criteria inventory classification (MCIC) problems by Considering an inventory with I items and these items are to be classified based on J criteria. The measurement of the ith item under the jth criteria is denoted as yij. To convert the multiple measures into a single score of an item using transformation formula
Items transformed = (Yij- min Yij {i= 1,2,…,I})/ (maxi= 1,2,….,I{Yij} –min i= 1,2,…,I{Yij}), can be adapted to convert all measurement in a 0–1 scale for all items.
Notably, the above transformation formula converts all measurements into the [0, 1] interval. Hereafter for simplicity, we suppose ymn is the normalized value of criterion n with respect to the inventory item m. Normalization of criteria has two main advantages. First, it avoids any problem arising from the criteria scale differences. Second, normalized data are fairly easy to interpret. It is worthy to mention that there exist several normalization methods in the literature. Some of the well-known normalization methods are listed below [2].
1. Ranking Method. It is the simplest normalization technique, which is not affected by outliers.
2. Standardization (or □Method. It converts indicators to a common scale with a mean of zero and standard deviation of one.
3. Min-Max Method. It normalizes criteria to have an identical range [0, 1] by subtracting the minimum value and dividing by the range of the indicator values.
4. Distance to a Reference Method. It measures the relative position of a given indicator of a reference point. The steps to group the items are listed below:
• Calculate all partial averages
• Compare and locate the maximum among these partial averages, the corresponding value is the score Si of the ith item.
• Sort the scores Si’s in the descending order.
• Group the inventory items by principle of ABC analysis.
Other literatures are also used ABC classification integrated with other techniques of inventory control; on coupling the two techniques ABCVED matrix was made and drugs were classified in to Category I (AV+BV+CV+AE+AD) comprising, Category II (BE + CE +BD) and Category III (CD). The management of Category I drugs was monitored by top management resulting in better control on the annual expenses and at the same time making available the vital Category II by middle and Category III at lower managerial level. [11]and[12] criterion, which depends on the nature of the industry, may be obsolescence, lead time, substitutability, reparability, criticality (Table 1)
| Second critical criteria | A | B | C |
|---|---|---|---|
| Dollar usage | |||
| A | AA | AB | AC |
| B | BA | BB | BC |
| C | CA | CB | CC |
All SKUs are divided into three levels of importance, A, B, and C, with respect to each of the two criteria. The model then reclassifies SKUs into three categories, AA, BB, and CC, which represent the three inventory control groups, according to a simple rule. The structure of the model can be conveniently represented as a joint criteria matrix as shown in the above figure as indicated by the arrows, the rule categorizes AB and BA with AA, AC and CA with BB and BC and CB with CC. it is applicable both to a service organization and manufacturing firms. According to [13] The inventory control approach called ABC–fuzzy classification (ABC–FC), which can incorporate manager’s experience, knowledge, and judgment into inventory classification fuzzy classification is important on the nature of nominal and non-nominal data is different. The criticality of a stock-out of the item, the rate of obsolescence, and the scarcity, substitutability, and order size requirement of the item and the lead time of supply With ABC–FC analysis, there are nine classified groups that could each require different management policies. To reduce the combinations to a manageable number, which is similar to traditional ABC analysis, we further combine nine classified groups into three combined groups as follows (Table 2).
| ABC | FC | ||
|---|---|---|---|
| Very critical(B1) | Critical(B2) | Uncritical(B3) | |
| A1 | A1 B1 | A1 B2 | A1 B3 |
| A2 | A2B1 | A2 B2 | A2B3 |
| A3 | A3 B1 | A3B2 | A3B3 |
• Very important group = {A1B1; A2B1; A1B2}
• Important group = {A3B1; A2B2; A1B3}
• Unimportant group = {A3B2; A2B3; A3B3} [14].
Data’s classified on different periods using ABC classification have gotten different group categorization [15].
Generally, all the above stated literatures have common characteristics to analysis ABC classification used multi criteria but they have used different approaches to classify the items.
Data Collection And Analysis
The annually data of all the items were obtained from the super market for a period of one year. The following data were collected from the super market (demand rate, unit price, and lead time) and all items are listed in table 3.
Step 1. If the two known points are given by the coordinatesand , the linear interpolate is the straight line between the given points. For a value x in the interval , the value y along the straight line is given from the equation.
which can be derived geometrically from the figure on the right and is a special case of polynomial interpolation with n = 1. It is identical to weight average which is inversely related to the distance from the end points to the unknown point; the closer point has more influence than the farther point. Thus, the weight, which are normalized distances between the unknown point and each of the end points.
Then we can transform it as follows: 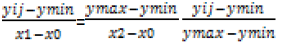

 This is called weighting average
Consider an inventory with I items and these items are to be classified based on J criteria. The measurement of the ith item (1, 2,….,n) under the jth (annual usage, average unit cost and lead time) criteria is denoted as y
. In our model development, we firstly transform all measures to comparable base using transformation the following formula
Items transformed = (Yij- min Yij {i= 1,2,…,I})/ (maxi= 1,2,….,I{Yij} – min i= 1,2,…,I{Yij}) (Tables 3,4 and 5).

Table 3. Matrix of ABC multi criteria and their transformed units.

table 4. Matrix of ABC multi criteria and their partial scores

Table 5. Matrix of ABC multi criteria maximum scores and their classification.
When generalize the comparison between traditional ABC classification (using annual usage only) and the new ABC classification (using annual usage, unit price and lead time) (Table 6).
| New ABC classification using annual usage, unit price and lead time | ||||
|---|---|---|---|---|
| Traditional | A | B | C | |
| ABC | A | 30 | 31 | 27 |
| classification | B | 32 | 40 | 60 |
| using annual | C | 26 | 62 | 134 |
| usage only | ||||
The above table shows that when compare traditional ABC classification with the new one;
• 30 items are retained as group ‘’A’’, 31 items are groupedin group ‘’B’’ and 27 items are grouped in the ‘’C” in the new ABC classification but all these
• 40 items are retain as group ‘’B’’, 32 items are groupedin group ‘’A’’ and 60 items are grouped in the ‘’C” in the new ABC classification but all these items are classified in “B” group in the traditional ABC classification.
• 134 items are retain as group ‘’C’’, 26 items are groupedin group ‘’A’’ and 62 items are grouped in the ‘’B” in the new ABC classification but all these items are classified in “C” group in the traditional ABC classification.
ABC classification is one of the most used items segmentation methods. The ABC inventory classification problem is classification of a large amount of items into three groups: A, very important; B, moderately important; and C, relatively unimportant. This hierarchy into three classes is based on the Pareto principle. This paper introduces an optimal multi criteria ABC inventory classification in super market to control the items based on unit price, annual usage and lead time. Out ofthe 442 items 30 items are retain as group ‘’A’’, 31 items are groupedin group ‘’B’’ and 27 items are grouped in the ‘’C” in the new ABC classification but all these items are classified in “A” group in the traditional ABC classification.40 items are retain as group ‘’B’’, 32 items are groupedin group ‘’A’’ and 60 items are grouped in the ‘’C” in the new ABC classification but all these items are classified in “B” group in the traditional ABC classification. 134 items are retain as group ‘’C’’, 26 items are groupedin group ‘’A’’ and 62 items are grouped in the ‘’B” in the new ABC classification but all these items are classified in “C” group in the traditional ABC classification.
Industrial Engineering & Management received 739 citations as per Google Scholar report