Perspective - (2022) Volume 11, Issue 6
Received: 06-Jun-2022, Manuscript No. MBL-22-71541;
Editor assigned: 08-Jun-2022, Pre QC No. P-71541;
Reviewed: 13-Jun-2022, QC No. Q-71541;
Revised: 18-Jun-2022, Manuscript No. R-71541;
Published:
25-Jun-2022
, DOI: 10.37421/2168-9547.2022.11.326
Citation: Ivery, Madison. “Bayesian Proteomics Pathways for
Function Prediction.” Mol Bio 11 (2022): 326.
Copyright: © 2022 Ivery M. This is an open-access article distributed under the
terms of the creative commons attribution license which permits unrestricted use,
distribution and reproduction in any medium, provided the original author and
source are credited.
Geman and Geman invented Gibbs sampling in order to simulate posterior distributions during image reconstruction. The term "Gibbs sampling" originated from the models employed in that research, which were Markov random fields with Gibbs distributions. There are several competing therapies available for the majority of healthcare issues. Randomized control trials (RCTs) are commonly used to evaluate the relative effectiveness of treatments. These RCT comparisons create a network of treatment comparisons around which information may circulate as long as the network is connected. Through network meta-analysis, such a corpus of evidence can be combined. Since NMA's methodology and tools were first formally suggested in 20026 as a generalisation of paired meta-analysis, they have advanced quickly. When doing NMA, software based on the hierarchical model typically uses other software or internal resources that are Bayesian in nature. To carry out NMA, Stata programme must call BUGS. The SAS software's proc genmod and proc glimmix, which are based on the software programming function, both employ the conventional linear model and the generalised linear mixed model to construct the hierarchical model; however, the proc MCMC is based on the Bayesian theory for carrying out NMA. Stata and Microsoft Excel are two examples of software based on regression models. The metareg module is a feature of Stata. The rma and nlme packages are part of the R programme. None of these can be used directly to do multi-arm research; they all need to be changed into a different format to study both arms [1,2].
One of the most fundamental components of statistical software is computing capacity. The currently available software each has its own features thanks to the ongoing upgrading of NMA methodology, which is based on the self-characteristics of the software and the variations in the implantation of the new methodology. Each piece of software is capable of implementing NMA computing on its own. Some programmes offered terminals from which they may be accessed by other programmes. The most well-known software called, for instance, is BUGS software. With their own independent operating capabilities, the R, Stata, and SAS software not only has the ability to call external software but can also be quickly summoned by external software. The relationships between the simulation programmes used for forms of mutual cooperation. The fundamental structure of NMA data has a more nuanced relevance. However, employing visuals is preferable for reflection. This structure is frequently more challenging to utilise since the performance is more constrained if their own data are used to interpret their internal relations and reflect the information's findings. In order to assess the quality, usefulness, and operability of software, one indicator is now its capacity to create highquality visuals. The following four graphic types are frequently required for NMA: network plot, forest plot, funnel plot, and ranking plot. Each of these four categories of graphics has a different amount of information, and each serves a different purpose in NMA [3-5].
A key component of the NMA result graphics is the ranking plot, which was inspired by the idea of contrasting the risks and advantages of various treatments. It is constructed in accordance with the risk-benefit probabilities of various types of interventions at each level. GeMTC, Microsoft Excel, ADDIS, R, and Stata are some of the programmes that can currently construct a ranking plot. The first three of these programmes do it automatically, while the latter two employ their own programming languages to render images. Only R and Stata, both of which employ unique drawing routines, have the capacity to render the aforementioned four pictures simultaneously. All R software packages can independently run NMA, but only some can also create a forest plot. The correctness of the calculative findings was a key criterion for choosing the programme when performing NMA. Other important considerations in the selection of software are the readability of the results and the ease of extraction. Information about the findings of the article's preceding series' summary. We discovered that the outcomes of each software were comparable. The R programme is typically utilised to collect the generated results and calculate the associated node's CIs when the Stata software uses the function by calling the WinBUGS software. The logarithmic effect imposes a restriction on the final results produced by three methods of calling the gemtc packages of R software [2].
In conclusion, research and development should focus on creating software that is simple to use, complete in its operations, accessible for free (or at a low cost), and has other desirable qualities. Software with full drawing capability, flexible operation, and user-friendly interface was researched, and its development is urgent due to the NMA's characteristics of complex production process and cumbersome operation, combination of multiple software programmes, large powerful calculations, and the high performance demands of NMA. Non-programming software needs to be updated frequently, which uses a lot of time and material resources and constantly changes operator behaviours. Non-programming software frequently establishes functional interfaces with programming capabilities or makes calls to external software to address the issue of delayed updating in a timely manner. Thus, in terms of renewal rate and function extension, this software is analogous to programming software.
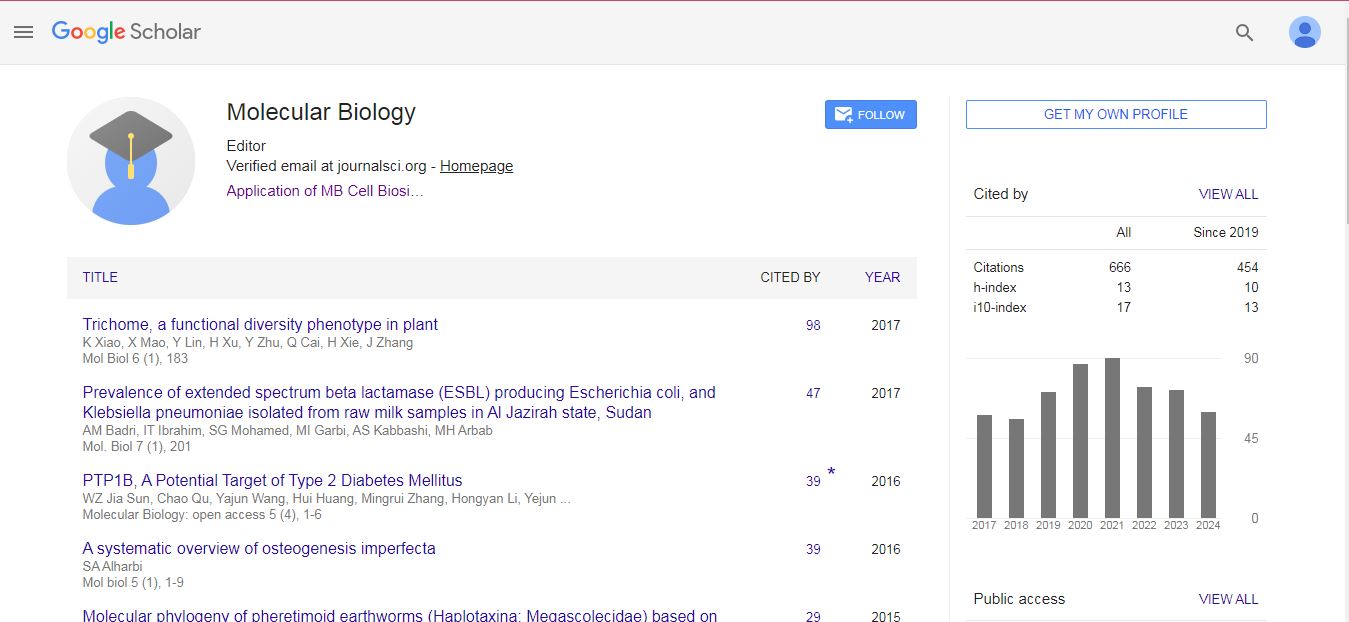
Google Scholar, Crossref, Indexed at
Google Scholar, Crossref, Indexed at
Google Scholar, Crossref, Indexed at
Google Scholar, Crossref, Indexed at
Molecular Biology: Open Access received 607 citations as per Google Scholar report