Research Article - (2021) Volume 8, Issue 10
Received: 15-Oct-2021
Published:
27-Oct-2021
, DOI: 10.37421/2380-2391.2021.8.334
Citation: Mbugua, James K, Gabriel A. Waswa, Damaris M. Nduta
and Joseph M. Mwaniki. “Characterization and Application of Eburru Zeolite Rocks in
Upgrading Biogas to Bio-Methane.” J Environ Anal Chem 8 (2021): 335.
Copyright: © 2021 Mbugua JK, et al. This is an open-access article distributed
under the terms of the creative commons attribution license which permits
unrestricted use, distribution and reproduction in any medium, provided the
original author and source are credited.
The trace amount of carbon dioxide and hydrogen sulphide in raw biogas lowers its calorific value, causes corrosion and makes it hard to compress the biogas into cylinders. Raw biogas was obtained from anaerobic digestion of cow dung and market wastes. The gas was stored in tubes or urine bags before upgrading process. Eburru natural zeolite rocks were used as the upgrade materials. The measured initial level of raw biogas was 0.0227% H2S, > 20% CO2 and 52-56% CH4. The total removal using zeolite was observed to be 75% CO2 and 95.34% H2S leading to 83.45 – 91.23% methane levels. The morphological structure of zeolitic rocks accounted for its higher upgrading properties. In addition, the porosity in these rocks meant that CO2 and H2S were adsorbed resulting in higher CH4 levels in the upgraded biogas.
Biogas • Upgrading • Natural zeolite • Bio-methane
Recently, sustainable solid waste management is becoming an issue of global concern due to the steady increase in population, urbanization and industrialization [1]. Anaerobic Digestion is a natural process where biodegradable material (biomass) is transformed by microorganisms to biogas in the absence of oxygen [2]. Biogas is acknowledged as one of the foremost bioenergy to address the current environmental and energy challenges being faced by the world. Commonly, biogas is used for applications like cooking, lighting, heat and power production. Many factors influence the composition of produced biogas e.g. location of the livestock complex, type of feed, environmental conditions, holding period of fermented manure, temperature of the process (mesophilic, thermophilic, psychrophilic), moisture of manure and the frequency of mixing the substrate in the digester. The resulting biogas contains 50-60% of methane and other gases depending on the substrate [3]. Impurities (hydrogen sulfide, water vapor and carbon oxides) adversely affect the operation of the fuel system of agricultural machines. Burning and interacting with water vapor, the impurities form acid residues, which result in increased rate of wear and tear of mechanisms [4].
To widen the scope of biogas application in areas like transportation, natural gas grid injection and as substrate for the production of chemicals and fuel cells; impurities, mainly CO2 and H2S need to be removed by various upgrading technologies. The CO2 in biogas reduces its calorific value and lowers the methane levels while H2S causes bad smell and rusting of gas valves. These impurities result in poor utilization of biogas for electricity generation, transportation or domestic cooking. For these purposes, biogas must have methane levels up to 94 ± 1.00% and is termed as CH4 - enriched biogas [5]. It is an important process to produce bio methane with above 90% methane. There are various Physico-chemical (adsorption, absorption, cryogenic and membrane separations) and biological (in situ and ex-situ) processes for biogas upgradation and each process is site and case specific [6]. CO2 adsorption on synthetic zeolites has become a consolidated approach for biogas upgrading to bio methane [7].
One of the techniques to remove trace substances in biogas is using microporous material. One form of the microporous material is zeolite. Zeolites are crystalline, Nano porous aluminosilicates composed of (TO4) tetrahedral (T=Si, Al) [8]. Zeolites have been widely used in petro chemistry, oil refining and chemical industries because of showing unique properties with respect to both activity and selectivity [9]. The size range of zeolite from 3 Å to 12 Å provides good selectivity for molecular transport into the zeolite crystal. Furthermore, the existence of active metal-phase and Brønsted acid sites in zeolite micro structure determined the activity of zeolite. The composition of Si/Al ratio also determines the acidity level and adsorption process [10,11]. However, although zeolites have high degree of micro porosity and thus high surface area, further proper chemical treatment may enhance adsorption capability. Under chemical activation a more opened pore structure is generated allowing better separation of wide range of dissolved pollutants in an effluent [12].
The zeolite filter retains CO2 molecules having size comparable to the size of zeolite microspores, for example, microspores in the Khongurin zeolite have a size of 0.4 nm, while CO2 molecule size is 0.31 nm. The size of the CH4 molecule is less than 0.2 nm, so they will pass freely through the zeolite filter, as it is required. That is, at the outlet of the filter there will be purified methane [13,14]. In the current study, Eburru natural zeolite rocks were characterized and employed in upgrade of raw biogas to bio methane.
Materials
Instrumentation applied in this study includeed X-ray diffractometer (XRD, D2 Phaser SSD160 A26-X1- A2DOB2B1, 2nd Gen. from Bruker), Fourier Transform Infrared (FTIR, IR Tracer-100 from Shimadzu), Energy dispersive spectrophotometer (EDS, Shimadzu EDX-720), Analytical balance (Fischer A-160), Scanning Electron Microscope (SEM, Hitachi S4800) and Calcinator (N3A Simon Muller 220V Berlin). The sample Eburru zeolite rocks (Figure 1) was collected from Eburru volcanic crater (0.63° S, 36.23° E), located about 8 Km North-West of Lake Naivasha within the Kenyan Rift Valley.

Figure 1. Eburru natural zeolitic rock.
Commercial zeolites, samples were applied as standard samples, used as received without further purification. Sample preparation involved mechanical grinding and sieving using 0.85 mm sieve to obtain very fine homogeneous particle sizes powder. The powdered samples were then calcined at 550°C for 2 hours to remove some of the organic and amorphous components.
Characterization
Physical and chemical characterization of the natural zeolitic rock sample and the commercial zeolites was done by using procedures elaborated in the earlier publications [15,16]. XRD was used to determine crystallinity and phase identification, EDX was used to determine elemental oxide composition FTIR examined the functional groups present in the sample, while SEM analyzed the surface morphology of the samples.
Biogas upgrading
The experiments were performed using raw biogas from cow dung feedstock and market wastes. The raw biogas used in this study was generated from cow dung mixed with water in the ratio of 1:1 as recommended by [17]. The substrates (cow dung from dairy cows and water) were loaded into a 0.5 – 1.5 liters’ digesters and biogas generated at psychrophilic conditions for 10 days’ retention time as described by [3]. The produced biogas was then stored in urine bags or tubes before being directed to biogas scrubbing unit (Figure 2) as described by [3].

Figure 2. Biogas production and storage set up.
Biogas composition was measured before and after upgrade using a portable biogas analyzer GP180 with accuracy level of ± 0.5% vol from Henan Ltd, China shown in Figure 3.

Figure 3. Biogas composition measurement using GP180.
The degree of gas purification efficiency was determined by equation 1 [18].
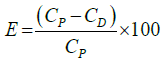 (1)
(1)
Where, E-degree of gas purification %
CD - methane content in biogas before purification
CP -methane content in biogas after purification
Sample characterization
The characterization of the Eburru zeolite rock sample was done to ascertain their properties and identity relative to the standard commercial zeolites, sample. This would determine their suitability for formulation and application in biogas upgrading to bio-methane.
X-ray diffraction analysis of sample (Figure 4) showed distinct peaks comparable to the ones informed by Donk SV, et al. [19], having 2θ values of characteristic artificial zeolite A at 7.2°, 10.3°, 12.6°, 16.2°, 21.8°, 24°, 26.2°, 27.2°, 30°, 30.9°, 31.1°, 32.6°, 33.4° and 34.3°.

Figure 4. XRD spectra of sample commercial zeolite rocks.
XRD characterization of Eburru zeolite rocks gave the characteristic spectrum shown by Figure 5 below, the corresponding diffraction parameter data summarized in Table 1.

Figure 5. XRD spectra of sample Eburru zeolite rocks.
| Index | Angle | d Value | Rel. Intensity |
|---|---|---|---|
| 2 | 23.612 | 3.76492 Å | 10.30% |
| 7 | 36.395 | 2.46657 Å | 10.60% |
| 3 | 25.640 | 3.47156 Å | 11.30% |
| 1 | 20.709 | 4.28560 Å | 20.40% |
| 5 | 27.336 | 3.25990 Å | 29.10% |
| 6 | 27.617 | 3.22740 Å | 29.20% |
| 4 | 26.512 | 3.35935 Å | 100.00% |
Donalite, Hollandite and Berlinite minerals were found to be the most predominant in this sample at 41.2%, 21.6% and 14.3% respectively. For each of the minerals present, their chemical formulae were determined as recorded in Table 2 below.
| Index | Compound Name | Formula | Pattern Number | I/Ic DB | S-Q |
|---|---|---|---|---|---|
| 5 | Hollandite | Mg0.376O8Rb0.751Ti3.624 | COD 9011334 | 3.190 | 21.60% |
| 4 | Ringwoodite | Fe1.234Mg0.766O4Si | COD 9001574 | 3.610 | 5.00% |
| 6 | Galobismutite | Bi1.85C10.168Pb1.14S3.738Se0.094 | COD 9004981 | 7.580 | 5.20% |
| 3 | Danalite | Be3Fe4O12SSi3 | COD 9000953 | 5.170 | 41.20% |
| 2 | Yeelimite | A16Ca4O16S | COD 9009938 | 3.630 | 7.20% |
| 1 | Berlinite | AlO4P | COD 9006404 | 6.390 | 14.30% |
| 7 | Hocartite | Ag2FeS4Sn | COD 1008963 | 13.790 | 5.40% |
EDX Characterization of Eburru zeolite rocks sample indicated oxides of Aluminum and Silicon at 18.8% and 37.4% respectively, alongside other oxides like of Fe and K as indicated in Table 3 below. Multiple peaks corresponding to the present elements are illustrated by the spectrum in Figure 6 below.
| Analyte | Result % | Standard Deviation | Line | Intensity ( cps/ uA) |
|---|---|---|---|---|
| SiO2 | 37.410 | 0.433 | SiKα | 0.7178 |
| Fe2O3 | 21.389 | 0.069 | FeKα | 116.996 |
| K2O | 20.671 | 0.149 | KKα | 1.8806 |
| Al2O3 | 18.764 | 1.649 | AlKα | 0.0294 |
| zrO2 | 0.609 | 0.004 | ZrKα | 29.8216 |
| MnO | 0.585 | 0.014 | MnKα | 2.8732 |
| CaO | 0.194 | 0.033 | CaKα | 0.2792 |
| NbO | 0.100 | 0.002 | NbKα | 5.9555 |
| SO3 | 0.075 | 0.004 | S Kα | 0.0746 |
| Y2O3 | 0.074 | 0.002 | Y Kα | 3.6852 |
| ZnO | 0.074 | 0.003 | ZnKα | 1.6514 |
| Rb2O | 0.057 | 0.002 | RbKα | 2.8905 |

Figure 6. EDX Spectra of Eburru zeolite rocks sample.
Zeolite A which was commercially acquired contained mainly oxides of Aluminium and Silicon at 56.0% and 44.0% respectively, as shown by Table 4, with its corresponding spectrum (Figure 7) below. This was used as standard reference in Energy Dispersive characterization of the other samples.
| Analyte | Result % | Standard Deviation | Line | Intensity (cps/uA) |
|---|---|---|---|---|
| Al2O3 | 56.368 | 1.335 | AlKα | 0.0721 |
| SiO2 | 43.632 | 0.398 | SiKα | 0.4315 |

Figure 7. EDX Spectra of commercial zeolite rocks sample.
FTIR characterization of Eburru zeolite rocks sample generated the spectrum below (Figure 8) and data in Table 5.

Figure 8. FT-IR spectra of Eburru zeolite rocks sample.
| Commercial zeolite rocks | Eburru zeolite rocks | Assignments |
|---|---|---|
| 3471.87 | 3421.72 | H-O-H Stretching of absorbed water |
| 2357.01 | 2360.87 | H-O-H overtone in plane bending |
| 1654.92 | 1635.64 | H-O-H Bending of water |
| - | 786.96 | Si-O quartz |
| 663.51 | - | Si-O-Si Bending |
| - | 447.49 | Si-O-Si Bending for internal tetrahedral |
Attributed bond bridge vibration to a range of wave numbers [20]. Notably, Si-O(Si) and Si-O(Al) could have asymmetric elongating vibrations nearing 1006 cm-1, Si-O-Si 82 symmetric vibration nears 726 cm-1. On the other hand, Si-O-Al symmetric stretching vibration bridge bonds near 670 cm-1, vibrations around 550 cm-1 could be thought of symmetric stretching of bridge bonds and bending for Si-O-Si and O-Si-O correspondingly, while lower wavenumbers of between 466 cm-1 and 250 cm-1 could correspond to distinctive bending vibrations occurring in four membered rings [21], of which similar peak was exhibited by Eburru zeolite rock sample at around 447.49 cm-1 suggesting that this particular sample had strong fundamental vibrations of alumino silicate framework composition in comparison to their natural rock samples.
Scanning Electron Microscopy (SEM) images provided evidence on sample external morphology and particle sizes. The commercial zeolite rocks sample which was artificial commercial zeolite A showed aggregated cubical particles of uniformly sized crystals of 10 μm length (Figure 9).

Figure 9. SEM images of sample commercial zeolite rocks.
They had better defined crystals with regular shapes, which seemed to have well-developed structures on surface and converged particles. These are similar observations made by Ines GPE, et al. [22] and Mohanraj J [23]. This could probably be due to high levels of crystal purity. The Eburru zeolite rocks sample showed that the particles were unevenly sized (Figure 10). The crystals were dense aggregates of irregular shapes, with not well-developed structures being observed on surface converged particles.

Figure 10. SEM images of Sample Eburru zeolite rocks.
Upgrading biogas to biomethane
The initial biogas composition levels were >20.00 ± 2.69%, 56.04 ± 7.56% and 0.022696 ± 6.87% for CO2, CH4 and H2S, respectively (Figure 11). The H2S levels compared well with those observed by Ji C, et al. [24] at 0.024535%. From the control experiments, no upgrade was observed when raw biogas was passed through the empty cartridges.

Figure 11. Plot of methane (%) and carbon dioxide (%) upgrade levels.
The CO2 adsorption onto the zeolite surfaces was observed to be higher compared to other upgrading material at 75%. The high efficiency of zeolite results from its larger porous size translating to deeper penetration [25]. The adsorption of CO2 predominantly occurred via Van Der Waals force. The attractive force between CO2, H2S molecules and adsorbent was higher compared to that of CH4 and adsorbent. This resulted in more impurity gases like CO2 is being tightly bound in the adsorbent while CH4 molecules tend to pass through the adsorbent [26].
In a study by Paolini V, et al. [7], a selective adsorption of CO2 and H2S towards CH4 was confirmed, allowing to obtain a high-purity biomethane (CO2 < 2 g m-3), i.e. 0.1%; H2S < 1.5 mg m-3), suitable for injection in national grids or as vehicle fuel [27], used adsorption-driven CO2 separation using the most prominent adsorbents, NaX (faujasite) and CaA (Linde Type A) zeolites (Figure 12). The NaX and CaA zeolites were structured into hierarchically porous granules using a low-cost freeze granulation technique to achieve better mass transfer kinetics. The freeze granulation processing parameters and the rheological properties of suspensions were optimized to obtain homogenous granules of NaX and CaA zeolites 2-3 mm in diameter with macroporosity of 77.9% and 68.6%, respectively. The NaX and CaA granules kept their individual morphologies, crystallinities with a CO2 uptake of 5.8 mmol/g and 4 mmol/g, respectively [27]. Investigated for the separation of CO2 from CH4, which is relevant for the upgrading of raw biogas with several commercial and potential adsorbents [5].
In this study Eburru natural zeolite rocks were used as the upgrade materials for biomethane. The measured initial level of raw biogas was 0.0227% H2S, > 20% CO2 and 52-56% CH4.
The total removal using zeolite was observed to be 75% CO2 and 95.34% H2S. The morphological structure of zeolitic rocks accounted for its higher upgrading properties. In addition, the porosity in these rocks meant that CO2 and H2S were adsorbed resulting in higher CH4 levels in the upgraded biogas.
The authors wish to express their sincere gratitude to the National Research Fund (NRF), grants no. 501-000-053 for funding this research work.
Journal of Environmental Analytical Chemistry received 1781 citations as per Google Scholar report