Original Research Article - (2024) Volume 9, Issue 1
Received: 01-Feb-2024, Manuscript No. jdcm-24-126999;
Editor assigned: 03-Feb-2024, Pre QC No. P-126999;
Reviewed: 17-Feb-2024, QC No. Q-126999;
Revised: 22-Feb-2024, Manuscript No. R-126999;
Published:
29-Feb-2024
, DOI: 10.37421/2475-3211.2024.9.244
Citation: Ferdjallah, Mohammed, Iman Ferdjallah, Zeid Khitan and Henry Driscoll. “Correlation Analysis between Plasma Calcium Homeostasis and Fluid Dynamics in Alzheimer’s Disease and Diabetes Mellitus Type 2.” J Diabetic Complications Med 9 (2024): 244.
Copyright: © 2024 Ferdjallah M, et al. This is an open-access article distributed under the terms of the creative commons attribution license which permits unrestricted use, distribution and reproduction in any medium, provided the original author and source are credited.
Disturbances of electrolytes during hyperglycemia is a common Abnormality in Diabetes Mellitus Type 2 (DMT2). Similarly, hyponatremia, a consequence of hyperglycemia, is often associated with Alzheimer's Disease (AD). This study investigated the association between AD and DMT2 by correlating plasma calcium homeostasis with plasma electrolytes. In this paper, we used plasma calcium homeostasis as a reference for Extra Cellular Fluid (ECF) volume changes. We determined the relative changes in plasma electrolyte concentration with respect to the relative changes in plasma calcium concentration. The study consisted of a cross-sectional study designed to analyse charts data from three patient groups during the period of 2010 to 2018. The study population consisted of three groups: AD-Only group, DMT2-Only group and AD-&-DMT2 group. The ADOnly group consisted of patients who developed AD but did not have DMT2. The DMT2-Only group consisted of patients who were diagnosed with DMT2 but did not develop AD. The AD-&- DMT2 group consisted of patients who had DMT2 and developed AD. Our results showed strong correlations between the relative changes in plasma sodium, plasma potassium and plasma chloride with those of plasma calcium in both AD and DMT2 patients. Patients with AD exhibit some degree of glucose intolerance even when not diagnosed with diabetes mellitus. Thus, it is prudent for health care providers to closely watch for DMT2 and AD development in all aging patients regardless of their presentation.
Diabetes mellitus Type 2 • Alzheimer’s disease • Plasma electrolytes • Concentrations • Extracellular fluid • Plasma calcium homeostasis
The risks for Diabetes Mellitus Type 2 (DMT2) and its complications have increased due to the rampant rise of obesity in the United States [1]. Excessive body weight increases the risk for many other diseases including metabolic syndrome, cardiovascular diseases, sleep apnea, cognitive impairments and Alzheimer’s Disease (AD) [2,3]. Although diabetes mellitus is a preventable cause of comorbidity, its management has proven to be very difficult due to the compounded physical and mental comorbidities. Diabetes mellitus and dementias have been associated through vascular pathology [4] and are common complications in the elderly [5]. AD encompasses a spectrum of dementias that have limited response to treatment [6]. There is mounting evidence to support the association between these two diseases and other various dementias [7]. Diabetes mellitus is characterized by impairments in insulin actions and signaling that leads to insulin resistance in peripheral tissues and results in hyperglycemia and hyperinsulinemia. Hippocampal insulin resistance has been associated with cognitive dysfunction [8]. Recent studies have suggested that increased release of insulin and amylin leads to neuronal loss, formation of senile plaques, proliferation of astrocytes and activation of microglia [9]. The senile plaques consist of extracellular deposits of amyloid beta formed by hyper-phosphorylated tau proteins altering neuronal synapses [10] in the brain and the hippocampus of AD patients [11]. Thus, insulin and growth hormones have been investigated for the treatment of AD [12]. Many interventions have been attempted for the treatment of AD using diabetic management [13], while other interventions were implemented to delay or alleviate the symptoms of AD [14].
The hallmark of diabetes is the dynamic change of fluid volumes and electrolyte concentrations. The excess of glucose causes osmotic diuresis to flush out the excess of glucose. Under normal conditions and physiological responses, the electrolytes of the body attempt to normalize accordingly. In particular, the sodium attempts to adjust its concentration to maintain the normal osmotic conditions of the cell. It may be excreted to normalize osmolality and the other electrolytes follow the sodium. Disturbance of electrolytes during hyperglycemia is a common abnormality in DMT2. Recently, hyponatremia has been associated with mild cognition impairment [15]. Hyponatremia has been also associated with higher infection rate, cardiovascular disease and mortality risk [16]. Hyponatremia can be manifested as an edema in most organs, but the central nervous system changes are delayed due to autoregulation [17]. Although, hyponatremia effects on the brain functions are often not well understood, cerebrovascular diseases are the underlying pathologic hallmarks of various types of dementias [18]. Episodic hyperglycemia may be a risk for dementia in patients with diabetes mellitus [19]. In chronic hyponatremia, however, the severity of symptoms may be reduced due to the osmotic equilibrium and autoregulation of the brain.
Recent studies have reported that chronic hyponatremia results in variable cognition impairment and cumulative effect, which may increase the risk for dementia seen in AD [20]. However, the effects of periodic transient hyponatremia, due to periodic episodes of hyperglycemia, are very hard to assess as most transient episodes would resolve when the hyponatremia is corrected [21]. Despite the dynamics of CSF control through autoregulation, the overall decline of electrolytes will challenge the rapid electrical activity of fast parts of the brain such as the hippocampus. These changes, when frequent, may progressively damage these parts of the brain. Furthermore, these changes are not predictable and are functions of the personal adaptation to the dynamic changes of glucose, volume and overall body electrolyte concentrations. Consequently, the changes in the hippocampus are not predictable also and thus the progression of AD and memory deterioration and dementia may not be the same for all patients. The relative normalization of electrolyte concentrations may not be useful for clinicians to follow as indicators of changes of mental status and mental capacity of patients who are at risk for dementia and AD. Currently, there are no specific diagnostic examinations to identify those at risk of developing AD or cognitive impairments [22]. Recent studies investigated imaging modalities that could be implemented to detect early hippocampus atrophy with limited success [23]. Although patients with diabetes mellitus have higher incidence for cognitive impairment and AD, the association between diabetes mellitus and AD is not well defined yet and thus the association of diabetes and AD requires new analysis and data modeling.
Calcium homeostasis is a significant physiological mechanism in maintaining ECF volume. Because the human body has an abundant capacity of calcium and the kidney has a strong control of calcium excretion and reabsorption, it is very likely that calcium homeostasis reflects the dynamic changes of ECF volume [24]. Without prior measurement of body weight of the patient, it is almost impossible to estimate the current body volume as compared to that before diabetic diuresis episodes. We hypothesize that the relative changes in the corrected plasm calcium concentration represents the relative changes in ECF volume caused by serum glucose excess. In this study, we addressed three main specific aims. In the first aim, we developed a model that represents the relationship between the relative change in the corrected plasm calcium concentration and that of the ECF volume using the mass-concentration principle. In the second aim, we extended the concept of plasma calcium homeostasis and developed expressions linking the relative changes in the corrected plasma calcium concentration to plasma electrolyte concentrations. In third aim, we applied the designed concepts of plasma calcium homeostasis in a cross-sectional study consisting of three groups to investigate the association between AD and DMT2 by correlating calcium homeostasis and electrolytes changes. We used data from electronic medical records of three patient populations during the period of 2010-2018.
Homeostasis of plasma calcium
Body fluid compartments are distributed based on the properties of electrolytes [25,26]. The homeostasis of the plasma calcium is tightly regulated. Normally, plasma calcium concentration is very stable and maintained by regulated absorption, secretion, mineralization, and demineralization processes. Acute changes in plasma electrolyte concentrations are generally caused by acute expansion and contraction of extracellular fluid volume. The plasma calcium concentration usually is corrected for the level of plasma albumin. If we assume that the total corrected plasma calcium concentration is quasi-constant between state (a) and state (b) and further, if we assume state (a) is the normal state, where the corrected plasma calcium concentration is equal to 9.5, the following expression can be derived between two states (a, b) for the corrected plasma calcium concentrations and ECF volumes at states (a) and (b)

Manipulating Equation 1, the relative change of the corrected plasma calcium concentration between state (a) and state (b) and with reference to state (a), we derive the following expression:

Based on Equation 2, the relative change in the corrected plasma calcium concentration is proportional to the relative change in ECF volume between the states (a) and (b). Thus, an increase in the relative plasma calcium concentration is balanced by a negative proportional relative change in ECF volume. The relative change in ECF volume between state (a) and state (b) can be derived from Equation 2 as a function of the relative change of plasma calcium concentration as follows:

Unlike plasma calcium, the other plasma electrolytes, in particular sodium and potassium, exhibit acute changes in concentrations that are not only attributed to changes in ECF volume, but also to an active loss or gain in their contents. Let us denote the change in the content of total plasma sodium between state (a) and state (b) as follows:

The relative change in the plasma sodium content with respect to the plasma sodium content of state (a) can be expressed as follows:

The total plasma sodium content of state (b) as compared to state (a) can be expressed as follows:

Organizing Equation 6 and expressing the changes in the plasma sodium concentration and the ECF volume as relative changes, we obtain the following expression as follows:

In state (a), the total plasma sodium concentration can be expressed as a function of the relative change of the ECF volume between states (a) and (b). Using Equations 2 and 6, Equation 7 can be expressed as follows:

Using calcium plasma concentrations ratio in Equation 1, Equation 7 can be expressed as follows:

With respect to the relative change in ECF volume, we can express the relative change in plasma sodium concentration as follows:
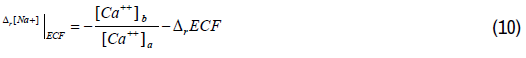
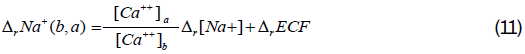
Equation 10 represents the relative change in plasma sodium concentration attributed to the relative change in ECF volume. This relative change in plasma sodium concentration is inversely proportional to that of ECF volume and thus proportional to the relative change in the plasma corrected calcium concentration. The relative change in plasma sodium concentration due to the change of plasma sodium content in the ECF cannot be measured practically, but we can estimate it using Equations 9 and 10. Because ECF volumes are not known at state (a) and state (b), we will need to express the ratio of these volume in term of relative change of ECF volume. Using the relative change notation, we can derive the relative change in the total plasma sodium content as follows:
We can derive equations similar to Equations 10 and 11 for the other plasma electrolytes.
Study design and data analysis
This study was conducted at Marshall University School of Medicine (MUSOM) and Cabell Huntington Hospital according to Institutional Review Board regulations. The Data Center at MUSOM has made the necessary provisions to protect the subject’s privacy and maintain the confidentiality of the data acquired in this study according to the Health Insurance Portability and Accountability Act of 1996 (HIPPA).
A total of 114,045 patient records were selected to participate in this study. The patients selected were aged 45 to 85 years. A thorough review of history and physical examinations was done to assure that the selection of patients is according to the inclusion and exclusion criteria of the study. Patients with abnormalities which might affect the normal course of diabetes mellitus or Alzheimer’s disease were excluded from the study. Patients with immobility, parathyroid and bone disorders, severe psychiatric conditions, unstable medical conditions, history of illegal intravenous drug abuse, history of alcohol abuse and history of hepatitis B or C were excluded from the study. Pregnant or lactating patients and immunocompromised patients were also excluded from the study.
The study consisted of a cross-sectional study designed to analyze charts data from three patient groups during the period of 2010 to 2018. These groups consist of AD-Only group, DMT2-Only group and AD-&-DMT2 group. The ADOnly group consisted of patients who were diagnosed with AD but did not have DMT2. The DMT2-Only group consisted of patients who were diagnosed with DMT2 but did not develop AD. The AD-&-DMT2 group consisted of patients who were diagnosed with DMT2 and AD. Patients’ outcome variables extracted from the electronic medical records included age, gender, a random glucose level, HbA1c level and plasma electrolyte concentrations. The plasma electrolyte concentration that were analyzed included sodium, potassium, chloride, bicarbonate, BUN, creatinine, albumin and calcium concentrations. Prior to data analysis, the outcome variables were extracted from the participating patients’ electronic medical records for further processing. The plasma calcium concentration was corrected for plasma albumin concentration for each patient. Descriptive statistics analysis were performed to estimate mean and standard deviation values of outcome variables for each study group.
To assess the changes in the plasma electrolytes’ concentrations, the changes in ECF was estimated as described in Section 2. Using the corrected calcium concentration as a measure of the extracellular fluid status, we computed the relative change in ECF volume. We then applied linear regression analysis to the outcome variables in three separate parts. In the first part, the linear regression analysis was performed on the outcome variables without data processing. In the second part, we applied the concepts of plasma calcium homeostasis to the electrolytes’ concentrations to estimate their total relative changes with respect to the corrected plasma calcium concentration. The relative change in the volume of each electrolyte was assumed to be proportional to that of the corrected plasma calcium concentration. Next, we estimated the relative changes in the plasma electrolytes’ concentrations with respect to the relative changes in the corrected plasma calcium concentration. In the third part, we estimated the relative change in the contents of the plasma electrolytes’ concentrations, mainly sodium, potassium and chloride. For the linear regression analysis of the outcome variables, we calculated the mean, standard error and the R squared values with 95% confidence intervals.
The study population consisted of inpatients and outpatients and was composed of 635 patients in the AD-Only group, 110,425 patients in the DMT2-Only group and 2,985 patients in the AD-&-DMT2 group. The AD-Only group has an age mean of 70 years (10 SD) with 68.7% of the patients are females. The DMT2-Only group has an age mean of 65.5 years (15.4 SD) with 58.0% of the patients are females. The AD-&-DMT2 group has an age mean of 67.0 years (8.0 SD) with 53.1% of the patients are females. As reported by various studies, our study confirmed the prevalence of AD in females more than males [27-29].
Table 1 lists the mean and standard deviation values of random glucose levels, HbA1c levels and plasma electrolytes’ concentrations in the three groups of the study. The random glucose and HbA1c levels are elevated in the DMT2-Only and AD-&-DMT2 groups indicating some glucose intolerance. The AD-Only group has an average glucose level (122 SD 40), in the high normal range, suggesting that patients in the AD-Only group have some degree of glucose intolerance. The average random glucose level in DMT2- Only and AD-&-DMT2 groups is 168 and 159 respectively. The remaining plasma electrolytes’ concentrations are within normal ranges across the study groups, suggesting an active process in normalizing plasma electrolytes. Therefore, the levels of plasma electrolytes’ concentrations may not reveal any abnormalities that suggest any association between AD and DMT2. Furthermore, even though, the plasma electrolytes’ concentrations are within normal ranges, their contents may have decreased due to the active regulatory process of the kidney.
| Item | AD-Only (N=635) |
DMT2-Only (N=110,426) |
AD-&-DMT2 (N=2,985) |
|||
|---|---|---|---|---|---|---|
| Mean | STD | Mean | STD | Mean | STD | |
| HbA1c | 5.9 | 0.3 | 6.7 | 0.1 | 6.1 | 1.2 |
| Random Glucose (mg/dL) | 122 | 40 | 168 | 86 | 159 | 77 |
| Sodium (mEq/L) | 140 | 5 | 139 | 4 | 140 | 4 |
| Potassium (mEq/L) | 4.0 | 0.5 | 4.2 | 0.6 | 4.1 | 0.5 |
| Chloride (mEq/L) | 106 | 6 | 104 | 5 | 104 | 5 |
| Bicarbonate (mEq/L) | 24.0 | 4.0 | 26.0 | 4.0 | 26.0 | 4.0 |
| BUN (mg/dL) | 20.0 | 11.0 | 23.0 | 16.0 | 24.0 | 15.0 |
| Creatinine (mg/dL) | 1.07 | 0.79 | 1.30 | 1.08 | 1.28 | 0.93 |
| Albumin (mg/dL) | 3.6 | 0.7 | 3.7 | 0.8 | 3.7 | 0.7 |
| Calcium (mg/dL) | 8.7 | 0.6 | 9.0 | 0.7 | 9.0 | 0.7 |
| Corrected Calcium (mg/dL) | 9.0 | 0.5 | 9.2 | 0.5 | 9.2 | 0.6 |
The linear regression analysis of the changes in the electrolytes’ concentrations with respect to the corrected plasma calcium concentration in listed in Table 2 – PART A. We estimated the relative change in ECF volume with respect to the relative change in the corrected plasma calcium concentration using Equation 3 (Table 2 – PART D). Across the study groups, the relative changes of ECF volumes are strongly correlated with the relative changes in the corrected plasma calcium concentration (R=0.980 with a 95% confidence interval (CI)= [0.977, 0.983]) with almost similar negative slopes (-0.118 to -0.111). This finding suggests that hyperglycemia is associated with hypovolemia and that the relative changes in the corrected plasma calcium concentration can be used to assess the relative changes in ECF volume.
| Item | Slope | SE | R2 | Slope | SE | R2 | Slope | SE | R2 | |
|---|---|---|---|---|---|---|---|---|---|---|
| AD-Only | DMT2-Only | AD-&-DMT2 | ||||||||
| PARTA | Sodium | -1.550 | 0.3897 | 0.024 | -0.428 | 0.0214 | 0.004 | -0.301 | 0.145 | 0.002 |
| Potassium | 0.146 | 0.0428 | 0.018 | 0.018 | 0.0031 | 0.000 | 0.107 | 0.0179 | 0.012 | |
| Chloride | -0.607 | 0.499 | 0.002 | -1.239 | 0.0265 | 0.019 | -0.267 | 0.1734 | 0.001 | |
| Bicarbonate | 2.881 | 0.3189 | 0.114 | 1.342 | 0.021 | 0.036 | 0.94 | 0.1296 | 0.017 | |
| BUN | -2.130 | 0.9366 | 0.008 | 1.145 | 0.0874 | 0.002 | 4.429 | 0.4788 | 0.028 | |
| Creatinine | -0.236 | 0.0646 | 0.021 | -0.013 | 0.006 | 0.000 | -0.13 | 0.0307 | 0.006 | |
| PARTB | Sodium | -0.915 | 0.0234 | 0.707 | -1.026 | 0.0014 | 0.836 | -0.981 | 0.0093 | 0.79 |
| Potassium | -0.735 | 0.08 | 0.118 | -0.957 | 0.0061 | 0.181 | -0.788 | 0.0356 | 0.141 | |
| Chloride | -1.059 | 0.0419 | 0.503 | -1.113 | 0.0024 | 0.667 | -1.034 | 0.0155 | 0.599 | |
| Bicarbonate | 0.035 | 0.1113 | 0.000 | 0.471 | 0.0078 | 0.032 | 0.621 | 0.0482 | 0.053 | |
| Bun | -0.005 | 0.5436 | 0.000 | -0.591 | 0.0539 | 0.001 | -1.534 | 0.2958 | 0.009 | |
| Creatinine | -0.577 | 0.5187 | 0.002 | -1.416 | 0.051 | 0.007 | -0.041 | 0.2612 | 0.000 | |
| PARTC | Sodium | -0.107 | 0.0029 | 0.686 | -0.114 | 0.0002 | 0.821 | -0.109 | 0.0011 | 0.774 |
| Potassium | -0.086 | 0.0095 | 0.114 | -0.107 | 0.0002 | 0.18 | -0.087 | 0.004 | 0.137 | |
| Chloride | -0.124 | 0.0051 | 0.489 | -0.123 | 0.0003 | 0.651 | -0.113 | 0.0018 | 0.576 | |
| Bicarbonate | 0.002 | 0.0132 | 0.000 | -0.055 | 0.0009 | 0.035 | -0.072 | 0.0054 | 0.056 | |
| Bun | -0.029 | 0.0647 | 0.000 | -0.032 | 0.0061 | 0.000 | -0.195 | 0.0331 | 0.012 | |
| Creatinine | -0.106 | 0.0616 | 0.005 | -0.123 | 0.0057 | 0.004 | -0.013 | 0.0292 | 0.000 | |
| PARTD | ECF | -0.118 | 0.0005 | 0.980 | -0.111 | 0.0001 | 0.980 | -0.111 | 0.0001 | 0.980 |
We then applied the concept of plasma calcium homeostasis to the plasma electrolytes’ concentrations and performed linear regression analysis with respect to the corrected plasma calcium concentration as shown in Table 2 – PART B. There is a strong correlation between the relative changes of the plasma sodium concentration and the relative changes in the corrected plasma calcium concentration (R=0.841 with 95% CI= [0.817, 0.862] for ADOnly, R=0.914 with 95% CI= [0.913, 0.915] for DMT2-Only and R=0.889 with 95% CI= [0.881, 0.896] for AD-&-DMT2). Similarly, there is a strong correlation between the relative changes in the plasma chloride concentrations and the relative changes in the corrected plasma calcium concentration (R=0.709 with 95% CI= [0.668, 0.746] for AD-Only, R=0.817 with 95% CI= [0.815, 0.819] for DMT2-Only and R=0.748 with 95% CI= [0.732, 0.763] for AD-&-DMT2). On the other hand, the relative changes in the plasma potassium concentration are modestly correlated to the relative changes in the corrected plasma calcium concentration (R=0.344 with 95% CI= [0.274, 0.411] for AD-Only, R=0.425 with 95% CI= [0.420, 0.430] for DMT2-Only and R=0.376 with 95% CI= [0.345, 0.406] for AD-&-DMT2). The relative changes in bicarbonate, BUN, creatinine show weak correlations with the relative changes in the corrected plasma calcium concentration (R<0.230). It is interesting to note that the sodium and chloride, being extracellular electrolytes, show strong correlations to the corrected plasma calcium concentration, whereas the potassium, being an intracellular electrolyte, shows a modest correlation. Bicarbonate, BUN and creatinine, on the other hand, only showed weak correlations perhaps due to their presence in both the extracellular and the intracellular compartments. Thus, changes in the ECF volume cause compensatory movement of bicarbonate, BUN and creatinine between the extracellular and the intercellular compartments. Figures 1-3 shows the distributions of relative changes in plasma electrolytes’ concentrations as functions of the corrected plasma calcium concentration for DMT2-Only, DMT2-&-AD and AD-Only groups respectively. Patients with high calcium concentrations were very likely suffering from various degrees of dehydration due to hypercalcemia.

Figure 1. Illustration of the relative changes in the ECF volume, plasma sodium, potassium and chloride concentrations with respect to the corrected plasma calcium concentration in DMT2-Only group.

Figure 2. Illustration of the relative changes in the ECF volume, plasma sodium, potassium and chloride concentrations with respect to the corrected plasma calcium concentration in AD-&- DMT2 group.

Figure 3. Illustration of the relative changes in the ECF volume, plasma sodium, potassium, and chloride concentrations with respect to corrected plasma calcium concentration in AD-Only group.
Finally, we estimated the relative changes in the content of plasma electrolytes with respect to the changes of the corrected plasma calcium concentration. The relative content changes follow the same patterns of correlation with respect to the changes in the corrected plasma calcium concentration (Table 2 – PART C). The relative changes in the content of plasma sodium (R=0.828 with 95% CI= [0.802, 0.851] for AD-Only, R=0.906 with 95% CI= [0.905, 0.907] for DMT2-Only and R=0.880 with 95% CI= [0.871, 0.888] for AD-&-DMT2) and plasma chloride (R=0.699 with 95% CI= [0.657, 0.737] for AD-Only, R=0.807 with 95% CI= [0.805, 0.909] for DMT2-Only and R=0.759 with 95% CI= [0.743, 0.774] for AD-&-DMT2) show strong correlations whereas those of plasma potassium (R=0.338 with 95% CI= [0.267, 0.405] for AD-Only, R=0.424 with 95% CI= [0.419, 0.429] for DMT2-Only and R=0.370 with 95% CI= [0.339, 0.401] for AD-&-DMT2) show a modest correlation with respect to the corrected plasma calcium concentration across the study groups. The slopes of the relative changes in the content of these electrolytes are negative indicating compensatory losses as the relative change in the corrected plasma calcium concentration increases. These compensatory losses are due to the regulatory activity of the kidneys to normalize the increased serum electrolytes concentrations.
To our knowledge, this study is the first to date to examine the use of relative changes in the corrected plasma calcium to estimate the relative changes in electrolytes’ concentrations and contents if there are no bone pathologies that cause drastic changes in the mineralization and demineralization of calcium. For clinical purposes, the estimation of these changes is extremely warranted. However, the measurement of the changes in the electrolytes’ concentrations is complex and not cost effective. The purpose of this study, therefore, was to investigate the association between DMT2 and AD by Figure 2. Illustration of the relative changes in the ECF volume, plasma sodium, potassium and chloride concentrations with respect to the corrected plasma calcium concentration in AD-&- DMT2 group. Figure 3. Illustration of the relative changes in the ECF volume, plasma sodium, potassium, and chloride concentrations with respect to corrected plasma calcium concentration in AD-Only group. analyzing the relationships among the plasma electrolytes’ concentrations using plasma calcium homeostasis as a reference for ECF volume changes. The study design consisted of a cross-sectional analysis of electronic medical data. However, despite of the large number of selected patients, the number of patients diagnosed with AD is very small due to the difficulties and the stigmata associated with the diagnosis. It is possible that only when the diagnosis of DMT2 was made that attention was given to the potential comorbidity with AD.
In this paper we investigate the use of the corrected plasma calcium concentration to estimate these changes. We computed the relative changes in the corrected plasma calcium to measure the relative changes in the electrolytes’ concentrations. Plasma sodium and plasma potassium showed strong and modest correlations with the corrected plasma calcium respectively in the study groups. Therefore, when calcium pathologies are absent, the use of corrected plasma calcium can be used to estimate changes in sodium and chloride. Sodium and chloride showed strong correlation because they are the major electrolytes of the ECF fluids. Potassium, on the other hand, showed a modest correlation, perhaps because it is not a major electrolyte of the ECF. The other electrolytes showed poor correlation with the corrected plasma calcium.
Nonetheless, this study has identified many significant findings. First, even though AD-Only patients were identified as not having diabetes mellitus, they had some degree of glucose intolerance. This may explain why the number of AD patients increase when a close attention was paid to them as far as glucose intolerance. Second, diabetes mellitus with even some degree of glucose intolerance may lead to changes in the ECF volume that may cause increased loss of electrolytes. This accumulative loss of electrolytes, especially sodium and potassium, may lead not only to arrhythmia, but also to transient and frequent changes in brain fluids despite its auto regulation. These changes may increase the risks for dementia and exacerbate its manifestation. Third, patients with Alzheimer’s disease seem to have some degree of glucose intolerance even when not diagnosed with diabetes mellitus. Thus, it is prudent for health care providers to closely watch for diabetes mellitus development in all aging patients regardless of their presentation.
In summary, although, random glucose and plasma electrolytes levels did not show any patterns with respect to the corrected plasma calcium, the relative changes in concentrations and contents of plasma sodium and potassium showed strong and modest correlations respectively across the study groups. Furthermore, ECF volume relative changes as computed through the relative changes in the corrected plasma calcium concentration decreased as the later increased with a strong correlation.
Data collected from the participating human subjects was professionally managed, saved and protected according to the requirement of the Health Insurance Portability and Accountability Act of 1996 (HIPPA) and the Institutional Research Board regulations of Marshall University School of Medicine. When possible, de-identified data will be made available to interested parties upon request by contacting the authors of the manuscript.
The authors did not receive any specific grant or financial support from any funding agency in the public, commercial, or not-for-profit sectors for the work reported in this manuscript.
None.
The authors of the manuscript certify that we have NO affiliations with or involvement in any organization or entity with any financial interest in the subject matter or materials discussed in this manuscript. The authors have no conflict of interest to disclose.
Journal of Diabetic Complications & Medicine received 102 citations as per Google Scholar report