Research Article - (2021) Volume 0, Issue 0
Received: 09-Jul-2021
Published:
29-Jul-2021
, DOI: 10.37421/2375-4389.2021.s2.374
Citation: Thea, NK, Mohammadou N and Nlom JH. "Determinants of Household Food Insecurity in Cameroon: Entitlement Approach." J Glob Econ 9 (2021): 374.
Copyright: © (2021) Theas NK, et al. This is an open-access article distributed under the terms of the creative commons attribution license which permits unrestricted use, distribution and reproduction in any medium, provided the original author and source are credited.
About 37.1% of households enjoy food security in Cameroon while the remaining 35.7% of households have limited food security. It was found that at least 30% of Cameroonian household in rural and urban areas remain vulnerable to food insecurity. The present study attempts to examine the effect of entitlement and identify the determinants of food insecurity in Cameroon household. Data are taken from Demographic and Health Survey (DHS) 2017 collected by the National institute of statistics (INS) of Cameroon. A wealth index was constructed from DHS data and we had employed FANTA III Household Dietary Diversity Score (HDDS) to group food insecurity household. We estimated the determinants of household food insecurity with a one predictor model .i.e. wealth index and a full predictor model including control variables. The main tools of analysis for this study consist of descriptive statistics and partial proportional odds model. Results showed that 22.69% of Cameroon household is severely food insecure and 20.4% are poorer. Regression results revealed that wealth index is highly significant (P<0.01 and P<0.05) determinant of household food insecurity in Cameroon. Control variables such as marital status, number of under-five children and gender of the household head were found to be significant determinant of household food insecurity in the study area. While, predictors like place of residence and household size were found to be non-significant determinants of food insecurity in this study.
Household food insecurity entitlement • Wealth index • Partial proportional odds model • HDDS • Determinants
Food security problems continuous to detriment the living standard of the world population and counter their development [1]. Debates on the question of solving food security problems are divergent and dynamic with the evolution of the world. Each debate is guided with a specific vision and an approach. A group of academics undertook the food security problem under the production aspect, while others think that the problem lies at the level of socioeconomic conditions. The production debate is guided by the pioneer work of Thomas Malthus who Predicted food security outcomes in his book, An Essay on the Principle of Population of 1798. His works regarded the origin of food problem in terms of growth of food supply falling behind the expansion of the population. His vision was shared by David Ricardo’s in his Comparative Advantages Theory and income-based approach analysed food security problem in terms of the relation between the physical magnitudes of food supply and population that is a decline of food availability per head [2]. While, the socioeconomic debates analysed food security problem in term of individual and household accessibility to food. The entitlement approach was developed which says that a person starves when he cannot establish his entitlement to the food that he needs [3]. And, when starvation is seen in terms of failure of entitlement rather than within the Malthusian focus of food supply per head, much of the mysteries of modern famines disappear. Instead of concentrating on the crude variable of food output per head, which is just one influence amongst many affecting the entitlement of different groups to food, the focus analysis should be on the ownership patterns of different classes and occupation groups and the exchange possibility through production and trade that these groups face.
The entitlement approach has permitted to re-address the problem of hunger and famine by diminishing the role of aggregate food supply and giving more relevance to the socio-economic conditions of people [2]. That primary concerns analysis in the 1970s with national and international bodies used to define food problems in terms of the level and reliability of aggregate food supplies; but this analysis had shift to a focus in the 1980s on individual and household food security, with emphasis on access, vulnerability and entitlement [3]. Food insecurity is implicitly assumed as a sub-category of poverty (often referred to as “food poverty”), i.e. lack of enough income necessary to buy at a given condition the amount of food required [4,5].
Moreover, certain authors say that food security approaches should not only address the technical and environmental dimensions of the issue, but also take social, economic, and political aspects into account [6-11]. As, it is observed a number of distinct failures, and the focal problem varies from region to region [12]. Poverty is considered as the root of food crisis. Household must have both access to the food that meets its nutritional requirements and the means to purchase same to be considered foodsecure [13]. This investigation aimed to determine the effects of entitlement on household food insecurity in Cameroon.
In Cameroon, the civil society development practitioners, government officials, and food researchers have generally agreed with the new conventional wisdom that food security is a multidimensional issue [14]. Cameroon economic growth is still lagging behind the average growth rate of Sub-Saharan African countries, with an economic diversify. These economic drawbacks are attributed to poor infrastructures, an unfavourable business environment, and weak governance that hamper economic activities. Therefore, makes it difficult to reach the growth rates needed to reduce poverty in a sustainable manner. This high rate of poverty challenges Cameroon efforts to achieve zero hunger and eradicate malnutrition by 2030 as required by sustainable development goal 2 [15]. In addition, the WFP approach to vulnerability analysis revealed that 27.6% of household have poor consumption of food, which is translated into 3.38 million people (2.84 million in rural area and 0.54 million in urban areas). Cameroon level of chronic poverty and its social indicators is remaining very low and going poorest, as a result, it was ranked very low i.e. 131 out of 179 countries in 201, 153 out 188 countries in the HDI and 150 out of 189 in the 2019 HDI and approximately 39.9% of its population of 17.9 million live below the poverty line. Consequently, Cameroon poverty situation has remains stable from 2001-2007 with 40.2% and 39.9% respectively has reveals that the number of poor people increased by 12% to 8.1 million.
The alarming poverty situation observed, discloses outcomes of chronic and unacceptable level of malnutrition in the country. To attempts these state of affairs, Cameroonian government adopted a number of policies and programmes both in the agriculture and social domains. In the agriculture sector programmes such as: the National Agricultural Investment Fund (PNIA 2014-2020), Programme for the Development of Rural Microfinance (PADMIR), the Agriculture Market Investment and Development Programme (PIDMA) and a roadmap for the reduction of chronic malnutrition were adopted. And in the social field: the National Policy for Social Protection (PNPS- French acronym), Nutrition Programmes operated by donors and development partners, mainly UNICEF, CARE, and Catholic Relief Services (CRS), Projet d’Assainissement de Yaoundé (PAD-Y) (cash-for-work) and WFP projects (food-for-work), the National Food and Nutrition Policy (2015–2035) and in the social Cash transfer program were take on. On the field, each program covers at best only 1% of the total population and they suffer from implementation challenges particularly targeting inefficiency.
Statement of the problem
Food insecurity, malnutrition and hunger are persistent within the urban and rural areas of Cameroon according to the National Institute of Statistics (INS). The poverty rate in 2007 was at 39.90%. It was observed by INS that this circumstances is not due to lack of food. But to poor systems regulating the access to food, resulting from an inadequate development policy approaches. It is noticed that household food security situations have deteriorated as compared to 2011. CFSVA found a 35% increase of rural household consuming an inadequate diets and around 16% of household were estimated to be food insecure (3.9 million people) with 1% severely food insecure (21 100 people). On the other hand, the regions of great Nord that have historically been exposed to issues related to food availability, access and utilisation are still amongst the most food insecure. The rigidity of poverty lived by the household passes of 5.0% in 2007 to 7.2% in 2014, this translated worsening of inequality or the consumption slip amongst the poor in this period. Declaration agreed with ECAM (2014) that the food insecurity in developing countries mainly caused by the inability of people to gain access to food due to poverty. Subsequently, this limited access to food affect 25% of rural and 12% of urban household [16].
However, discloses that adequate supply of food at the aggregate level does not guarantee that people have enough to eat, nor that hunger will be eliminated [17]. This is why, the entitlement approach says to better identify the causes of food insecurity more relevance should be given to the socio-economic conditions of people instead of focalising in addressing the problem of food insecurity by aggregate supply [2].
Objectives of the study
The main objective of this research is to assess the determinants of household food insecurity in Cameroon. The specific objective is to determine the effect of entitlement on household food insecurity in Cameroon.
An overview of survey area
This study was conducted in Cameroon. Cameroon is a lower middleincome country with a population of over 25 million people of 230 ethnics and linguistic groups. It is located along the Atlantic Ocean; it shares its borders with Chad, Gabon, Equatorial Guinea and Nigeria.
Data source
The study data were drawn from Demography and Health Survey (DHS) 2017 collected by the National Institute of Statistics in conjunction with the World Bank. DHS are amongst the best household survey on microeconomic information and depends mainly on household schedules and questionnaires for women aged 15-49. Women are asked variety of information concerning their household on topics such as education, age, assets, non-tangible resources, employment status, marital status, residence, religion, culture, health and nutrition. DHS provides relevant indicators for analysing determinants of household food security.
Dependent variable
The only dependent variable used for this study was household dietary diversity score (HDDS) castoff to line Household food insecurity. According to HDDS is an appropriate indicator to measure food access and utilization [17,18]. The HDDS indicator provides a glimpse of a household’s ability to access food as well as its socioeconomic status based on the previous 24 hours recalled period [19,20]. The assessment summaries the 16 food groups into 12 food groups, according to the recommendations set by FAO operational guidelines for measuring dietary diversity in a standardized way developed by Food and Nutrition Technical Assistance (FANTA III) tools. The household score will range from 0 to 12 and classification depends on the total number of food groups consumed by the household. Due, to the absence of a universal cut-off or target level that indicates that a household is adequate or inadequate diet diversity, it is recommend to use the mean score for analytical purposes. Based on the mean score household is rank as follows: severely food insecure equal ≤1, moderately food insecure equal >1 and ≤ 3, mildly food insecure equal 3> and ≤5 and food secure >5 [21,22].
Economic variable of interest: wealth index
Household wealth index was assessed based on the set of assets owned. The set of assets ownership permit to have an idea on long term of household economic vulnerability compared to the income which gives information on short term vulnerability of household [2]. Wealth index/ set of assets was constructed based on the value of all natural, physical and financial assets owned by a household, reduced by its liabilities. The different set of assets were computed to form a composite score. In this study the score was derived from 15 variables that is physical assets included electricity, radio, television, refrigerator, bicycle, motorcycle/ scooter, car/Truck, cooking fuel, owner of a house, owner of a piece of land) and housing characteristics variables are sources of drinking water, types of toilet facility, main floor material, main Wall material, and main Roof material). Statistical Package for Social Science Statistics (SPSS version 18) was used in coding data and treatment of the data. The scores were computed using principal component analysis (PCA), based on the steps of 2017 in VAM Guidance Paper: Creation of Wealth Index. The wealth index scores have a Kaiser Meyer-Olkin (KMO) of 0.822 with a Bartlett coefficient (ρ) of 0.000 and variance explained of the first component of 35.259 [23]. As such, Wealth index score will categorised the population as poorer, poor, mild, rich and richer.
Control variables
Control variables used in this study were carefully chosen based on literature reviews and statistical significance [24-31]. Five control variables consisting of sex of household head (female, male), place of residence (rural, urban), marital status (married, otherwise), household size (small ≤ 5, Medium >5 and <=10, Lager>10 and ≤15, Very large>15), number of under-five children (Small <=2; medium>2 and ≤4; large>4) were used.
Statistical analysis
The statistical analysis contains two stages. First, summary statistics of the dependent variable and all independent variables were produced. Second, multivariate analysis was performed. The multivariate regression statistical analysis was elaborated as follows:
View that the dependent variable in this research is a four-category ordinal outcome, generally for ordinal outcomes (such as food security) it is traditional to use an ordinal logistic or probit modeling strategy. But these models assume that coefficient do not vary across cut point equations. That is, the ordinal model assumes that effects of independent variables are equal at different thresholds (i.e. categories) of the dependent variable. Consequently, these models “proportional odds” assumption is often violated, which shows that ordinal logistic or probit regression models are not suitable. To address such a situation, a partial proportional odds models, also denoted to as a generalized ordinal logistic models is recommended [32,33]. The advantage to use PPOM is that it is more accurate than ordinal regression models and more parsimonious than multinomial regression models for the reason that not all variables are likely to violate the proportional odds assumption and the proportional odds assumption is allowed to relaxed for those variables that violate the assumption [34]. A Wald statistic test is used to determine if a predictor violates the proportion odds assumption; in this study plus the conventional cut-off of p = 0.05 was used. The partial proportional odds model estimates additional coefficients for predictors which have violated the proportional odds assumption. The PPOM has been used in many previous studies with ordinal dependent variables [24-31]. To fit the PPOM in Stata 15, the gologit 2 packaged was executed. This command is an improvement of gologit command, which, as a general model, can be written as follows:
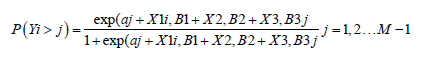
Where M is the number of categories of the ordinal dependent variable. When the model of household food security is expressed in term of probability Y becomes
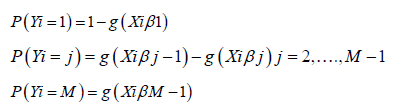
Where Y represents the categories of household food security and X_i denotes the independent variables. The association between the dependent variable and independent variable was measured in odds ratio (OR), standard errors and P values.
This section discusses the results of descriptive statistics, the model coefficient estimates, the odds ratios, and predicted outcomes probabilities.
Sample descriptive statistics
The list wise deletion process produced an analytic sample of 1,891 households. The base category for this variable is household food insecurity. The results of descriptive analyses of the dependent and explanatory variables are presented. More than one quarter of household in Cameroon are severely food insecure (28.66%), followed by mildly food insecure with (34%), and 14% for the moderately food insecure, while, only 22.69% of household are food secure. On the other hand, 20.36% of household are poorer .i.e. they possess zero assets at their disposal; 19.99% of household are poor and 19.73% of household are mild, while the rest of 21.26 and 18.69% are the rich and the richer, respectively. A strike finding of this analysis it that the level of severely poverty is very high and alarming. Majority of household are married (93.60%) and otherwise (6.40%). Most households were headed by a male (84.35%). Besides, more than half (61.77%) of households were located in rural areas, while, the rest of 38.23% were located in urban areas. The predominant type of house is a medium household size (47.12%) followed by small size (36.01%) and the 11.74% and 5.13% were for large and very large household size, correspondingly. Approximately, 66.37% had a medium number of under- five children, 26.03% had small number of under-five children, whereas, 5.61% had large number of under-five children. This indicates a high level of dependency ratio in household (Table 1).
| variables | N | Per cent (%) |
|---|---|---|
| Food security | ||
| Food secure | 429 | 22.69 |
| Mildly food insecure | 643 | 34 |
| Moderately food insecure | 277 | 14.65 |
| Severely food insecure | 542 | 28.66 |
| Wealth index | ||
| Poorer | 385 | 20.36 |
| Poor | 378 | 19.99 |
| Mildly | 373 | 19.73 |
| Rich | 402 | 21.26 |
| Richer | 353 | 18.67 |
| Marital status | ||
| Married | 1.77 | 93.6 |
| Otherwise | 121 | 6.4 |
| Sex of Household head | ||
| Male | 1 595 | 84.35 |
| Female | 296 | 15.65 |
| Place of residence | ||
| Rural | 1.168 | 61.77 |
| Urban | 723 | 38.23 |
| Under-five children | ||
| (Small <=2; | 530 | 28.03 |
| medium>2 & ≤4; | 1.255 | 66.37 |
| large>4 | 106 | 5.61 |
| Household size | ||
| small ≤5, | 681 | 36.01 |
| Medium >5 & <=10, | 891 | 47.12 |
| Lager>10 &≤15 | 222 | 11.74 |
| Very large>15 | 97 | 5.13 |
Modeling regression results
The partial proportional odds relationship between the dependent variable, independent variable and control variables. This relationship is analysis based on the Log-odds coefficient, standard errors and P-value for the model. We note in the footnotes of table the variable which has violated the proportional odds assumption. We report three coefficients for the variables that were found to violate the assumption. The variable wealth index is found to violate the proportional odds assumption via Wald test, thus we provide a coefficient in the column which compares “Y=1 as moderate through food secure vs severely food insecure”; “y=2 as mildly and food secure vs severely and moderately” and another which compares “y=3 as food secure versus severely, moderately and mildly food insecure. No coefficient in Y=3 column means that the effect of that particular variable is symmetrical across categories of the food security. The P-value associated with the Wald test for this model can be found in Appendix 13, a significant test indicates that the proportional odds assumption has been violated.
Models results:
The final modal is statically significant (P<0.001) with McFadden adjusted R2 of 0.0312. The result comprises three models. The three models compare the four categories (Table 2).
| Variables | Coeff | S.e | Odds ratio | S.e |
|---|---|---|---|---|
| M1= Moderate through food secure vs severe food insecure | ||||
| Wealth index | ||||
| Poor | 0.104 | 0.133 | 1.109 | 0.148 |
| Mild | -0.094 | 0.163 | 0.91 | 0.149 |
| Rich | -0.0139 | 0.172 | 0.87 | 0.15 |
| Richer | 0.045 | 0.192 | 1.046 | 0.2 |
| Marital status | ||||
| Married | -0.772*** | 0.185 | 0.462 | 0.085 |
| Under-five Children | ||||
| Medium | -0.227** | 0.104 | 0.797 | 0.083 |
| Large | -0.841*** | 0.258 | 0.431 | 0.111 |
| Household size | ||||
| Medium | -0.092 | 1 | 0.912 | 0.918 |
| Large | -0.151 | 0.153 | 0.859 | 0.132 |
| Very large | 0.231 | 0.254 | 1.259 | 0.32 |
| Place of residence | ||||
| Rural | -0.17 | 0.113 | 0.844 | 0.095 |
| Household sex | ||||
| Female | -0.222* | 0.123 | 0.801 | 0.099 |
| M2= Mild and moderate vs food secure vs severe | ||||
| Poor | 0.104 | 0.133 | 1.109 | 0.148 |
| Mild | 0.303*** | 0.148 | 1.354 | 0.201 |
| Rich | 0.661*** | 0.158 | 1.937 | 0.303 |
| Richer | 0.684*** | 0.17 | 1.982 | 0.338 |
| M3= food secure vs severly, moderate, mildly | ||||
| Poor | 0.14 | 0.133 | 1.109 | 0.148 |
| Mild | 0.539*** | 0.168 | 1.715 | 0.287 |
| Rich | 1.055*** | 0.168 | 2.873 | 0.482 |
| Richer | 1.081*** | 0.181 | 2.949 | 0.533 |
| Alphas | ||||
| α1 | 2.375*** | 0.251 | 10.755 | 2.701 |
| α2 | 0.479 | 0.245 | 1.614 | 0.395 |
| α3 | -0.43 | 0.25 | 0.651 | 0.162 |
| LR chi2(18) = | 158.41 | |||
| Wald chi2 test | 0.001 | |||
| Pseudo R2 = | 0.0312 | |||
Note: coeff = coefficient of explanatory variables; S.e= standard errors; variables that violate the proportional odds assumption= mild, rich and richer.
*p≤0.1 ; **p≤0.05 ; ***p≤0.01
Severely food insecure, moderately food insecure and mildly food insecure. The first panel contrasts moderately food insecure through food secures vs severely food insecure. That is, the signs of the coefficients in the first panel imply how likely a household is to express a definitely severely food insecure condition as opposed to the remaining three categories. Likewise, the second panel contrasts mildly food insecure and food secure with the severely food insecure and moderately food insecure. The third panel contrasts the food secure category with severely food insecure, moderately food insecure and mildly food insecure. Each panel gives the results for two versions of the estimates, i.e. in coefficients and odds ratio estimates.
Overall, the model estimates 20 coefficients, i.e. 12 in the first panel, and four each in the remaining two panels. The coefficients and odds ratios that are left out in the last two panels are equivalent to those in the first panel. The wealth index in the last two panels is the variables that were found to violate the parallel lines assumption. The partial proportional odds model therefore allows the coefficient of these variables to vary across the J-1 equations.
The current category and lower-coded categories are taken as the base group. That is the results in the mth panel are equivalent to those of a binary log it model where categories 1 to m are coded as zero (as the base group) and categories m+1 to J are coded as one. Therefore, positive coefficients or odds ratios greater than 1, implies that higher values of an explanatory variable increase the probability that a household is in a higher category of Y than the current one. while, a negative coefficient or odds ratios less than 1, imply that higher values of an explanatory variable increase the probability of being in the current or a lower category [25]. For the wealth index variable that does not meet the parallel lines assumption, their coefficient estimates and odds ratios differ in each panel (wealth index).
The demographic variables used in this study were: place of residence, sex of household head, marital status of household head, household size and number of under-five children. Place of residence and household size were found to be non-significant (β= - 0170, p=0.130, which is not significantly different form zero. OR= 0.844 and β=-0.092, -0.151 and 0.231, p= 0.352, 0.323 and 0.364, with OR=0.912, 0.859 and 1.259, respectively) this indicates that there is no relationship between the place of residence and household size, and the odd of being food secure. As for the variable sex of household head it was observed to be significantly associated with the odds of household being food insecure (β=-0.222, which is negative. OR=0.801 which is less than 1. This indicates that being beyond a particular food security category (food secure) decreases by a factor of 0.222 for a one unit increase in female household head when all the other predictors remain constant. Marital status of household head was observed to be significantly associated with the odds of being food insecure compared to the odd of being food secure. With household headed by married person (β=-0.772 which is negative, OR: 0.462, less than 1). It shows that the odd of household being beyond a particular category of food security (food secure) decreases by 0.462 for a one unit increase in the predictor married, when the other predictors remains constant. Moreover, the number of under-five children was found to be associated with household food insecurity as oppose to food security. It is also associated with low odds of becoming food secure. The magnitude of those relationships are (β=- 0.227 and β-0.841, with OR=0.797 and 0.431, correspondingly) they are all less than 1. It specifies the odd of being beyond a particular food security category (better food secure) decreases by 0.797 and 0.431 respectively, for a one unit increase in under-five children in a household, with all the other predictors constant.
Next, let interpret the variables that violated the assumption. As identify from the output above, only one predictor i.e. the wealth index violated the assumption. So, the odds ratio for wealth index was different across the three binary models. For simplicity we are going to analysis the odds ratio of one of the wealth index dummy variable across the three models. The three binary odds ratio for the dummy variable mildly food insecure are 0.910, 1.354 and 1.715, respectively. From these results it is observed that the odd of being food secure increases with increase in household wealth. In other words, the number of assets possess by households is associated with the odd of a household being in a better food secure condition.
Predicted probability:
The predicted probability looks at what the outcome probabilities are when there is a variation in a variable or a subset of variables. The predicated probability or the margin computes when the outcome variable Y=1 for predictor variables at specified values. The estimated probability will be plotted to appreciate the progression or regression movement along the different food security categories in relation to the wealth index. Those variables that met the proportional odds assumption are held on their means for continuous variables and the mode for binary variables (Appendix 15) (Table 3).
| Variables | Scenario 1 | Scenario2 | Scenario 3 |
|---|---|---|---|
| Wealth index | Mild | Rich | Richer |
| Pr (Severely food insecure) | 0.236 | 0.245 | 0.212 |
| Pr(Moderately food insecure) | 0.345 | 0.246 | 0.274 |
| Pr (Mildy food insecure) | 0.15 | 0.126 | 0.126 |
| Pr (Food secure) | 0.269 | 0.381 | 0.388 |
Three scenarios with scenario 1 as the baseline scenario, against which other scenarios may be equated with each household represents a hypothetical household with the characteristic as listed. A household with characteristics as depicted in the base scenario observes the highest probability of having a household food secure at moderately food insecure level .i.e., Pr(Y=moderately food insecure) =0.345. Scenario 2 depicts a household favourable perception of household possession of assets on food security, while her other characteristics remain the same as in scenario 1. A household with a good possession of assets is more likely to have a food security state than a household with only a few possession of assets .i.e., Pr (Y=food security) =0.381 of scenario 2, versus P(Y=food security) =0.269 of scenario 1.
In the same vein, scenario 3 depicts a household with a great possession of wealth is more likely to be food security. Scenario 3 see the probability of household to be food secure increases from Pr(y= food secure) =0.381 to Pr(y=food secure) =0.388, for scenario 2 and 3, individually.
Let us compare scenario 3 and 2. The probability of expressing a household being severely food insecure in scenario 2 is Pr(y=severely food insecure) =0.245. Now, we would have expect this probability to be a somewhat a mirror image of scenario 3 Pr(y=food secure) =0.388 since the only difference between scenario 2 and 3 lies in the five demographic attribute. The large disparity between scenario 3’s Pr(y=food secure) =0.388 and scenario 2’s Pr(y=severely food insecure) =0.245 suggest that differences in household demographic characteristics (as depicted in Scenario 2) are not strong as determinants in influencing the probability of having a household severely food insecure, as compared to a great possession of assets (as depicted in Scenario 3) in influencing the probability of having a household food secure.
The predicted outcomes probabilities can be represented in a graph for simplicity of understanding of their variation across the different scenarios (Figure 1).

Figure 1. Estimated probabilities of being in categories 1, 2, 3 and 4 for wealth index. As presented in the figure above, an increase in household possession of assets, the probabilities of being in categories 1 and 2 decreases, whereas the probabilities of being in categories 3 and 4 increases.
This section sketches a careful interpretation of the major findings of this research, which investigated the factors determinants associated with household food insecurity in Cameroon. That is, the effect of entitlement on household food insecurity in Cameroon. The dependent variable is household food insecurity measured as severely food insecure, moderately food insecure, mildly food insecure and food secure. The economic variable wealth index, was the main variables of interest and controlled by five demographic variables .i.e. household size, sex of household head, number of under-five children, and place of residence and household head marital status.
This study highlights the importance of economic variable in association with household access to food security. Assets have commonly been used as economic indicators. In consistent with previous studies these investigations found that having an adequate wealth index corresponds to a higher likelihood of having access to a better food security. Wealth index proportional significance remains unvaried under interaction with control variables. This indicates that it is likely the main determinant of accessibility of household food security in Cameroon [26-32]
As for household demographic characteristics, marital status of household head significantly differentiates the probability of having access to better food security. In South Africa i.e. household food insecurity increases with marital status. Finally, being a single household headed, as opposed living in other household type, corresponds to lower probability of being food secure. A possible explanation could be that married household engages responsibility and an increase in household size consequently increase in household purchasing power.
Moreover, gender of the household head is positively associated with household food insecurity. Results show that the majority of food insecure households were female headed. However, more recent studies did not found any significant relationship between gender of the household head and household food insecurity [31,32].The latter study argued that a possible explanation behind such relationship is that having access to better food security is a function of household wealth possession, instead the sex of the household head.
With respect to household number of under-five children, having a great proportion of under-five children in dwelling, corresponds to a low likelihood of having a better food secure condition. This parallels the findings of which observed that a high number of under-five children were associated with household food insecurity. A likely explanation may be that under-five children are at their growing stages of life and demand a good quality, quantity and diversify food consumption to prevent malnutrition and ensure an adequate development. To satisfy these demands it requires possessing a good amount of resources [32].
In term of household size, no significant relationship was observed and the odds of household food insecurity were unexpected. This implies that a dwelling size does not determine household food insecurity, instead, household wealth possession. In South Ethiopia found that a large household size increases household food insecurity compared to a small household size. In addition, similarly achieved a positive link amongst household size and household food insecurity. The result shown above may be that household access to food is determined by assets possession than household size. With regard to the place of residence, it was found to be non-significant to household food insecurity [34-39]. This may be because it is the purchasing power that determines household availability and accessibility to goods and services, not the environment where we find ourselves. Therefore, hunger or food insecurity is not determined by food supply or the environment, but on the ability to have access i.e. being entitle to a bundle.
The study was aimed to address the effects of entitlement factors on household food insecurity in Cameroon. The findings from this study suggest that household wealth index is the main determinant of household access to food security. The economic variable wealth index presented disparities in distribution of wealth, so, this leads to disparities in household food security. Moreover, households headed by married persons are associated with a likely odd of being food insecure and household headed by female was positively associated with an odd ratio of being food insecure. In terms of demography factors, household with a great proportion of under-five children were more likely to be food insecure. While, place of residence and household size indicate that there is no relationship between these predictors and the odds of being food insecure in Cameroon.
In the light of these findings, some recommendations are proposed. The government should reorganised its policy of wealth distribution amongst Cameroonian. For, the absence of entitlement in more than 20% of the population is one of the main reasons for household food insecurity. That is improvement in the living standard of Cameroonian household could increase their likelihood of being food secure. The government should create more employment opportunities for female view that they are more vulnerable than their male counterpart.
Journal of Global Economics received 2175 citations as per Google Scholar report