Research Article - (2021) Volume 11, Issue 7
Received: 15-Apr-2021
Published:
26-Jul-2021
, DOI: 10.37421/2165-784X.2021.11.401
Citation: Bethelhem Awoke, Mequanint Birhan Alem. “Effects of Saline Water and Irrigation Interval on Soybean (Glycine max) Yield.” Civil Environ Eng 11 (2021): 401.
Copyright: © 2021 Awoke B, et al. This is an open-access article distributed under the terms of the Creative Commons Attribution License, which permits unrestricted use, distribution, and reproduction in any medium, provided the original author and source are credited.
The declining availability of fresh water has become a worldwide problem, which maintains the development of alternative, secondary quality water resources for agricultural use. Several studies recommend that give attention for selected crops that can tolerate a degree of water and salinity stresses when saline water is used for irrigation. In this study, the effects of different irrigation intervals at different salinity levels of irrigation water on Soybean yield and their impacts investigated using three irrigation intervals (I1 =3 days, I2=4 days and I3=5 days) with four salinity levels (S1=4 dSm-1, 5 dSm-1 and 6 dSm-1) in a factorial combination using CRD with three replications. The result showed that salinity, irrigation interval and their interaction were highly significance effects (p<0.001) on number of pod per plant, number of seed per plant and grain yield of Soybean. The highest number of pod number (88.33), grain yield (2.31 ton/ha) and number of seed per plant (172.33) was recorded from Soybean which was irrigated with the first salinity level, i.e., fresh water (S1) with irrigation interval one (3 days), S1I1; while the lowest pod number per plant (6.67), number of seed per plant (12.67) and minimum grin yield (0.034 ton/ha) was obtained from Soybean irrigated by salinity level four (S4) with 5 days irrigation interval (S4I3).
Salinity • Soybean • Irrigation interval
Water salinity is the most serious water quality problem in agriculture and an environmental stress factor that hinder growth and yield of different crops in many regions of the world [1]. Most of the developing countries, irrigated agriculture plays an important role in food supply of a growing population [2]. Salinity is one of the most serious factors limiting the productivity of agricultural crops, with adverse effects on germination and crop yield [3]. Several crops are sensitive to salinity and the negative effect on growth leads to the decrease in potential profits. For this reason, salinity has been considered as one of the most factors in irrigation water [4]. High salinity lowers water potential and encouraged ionic stress, and results in secondary oxidative stress. It severely limits growth and development of plants by affecting different metabolic processes such as CO2 assimilation, oil and protein synthesis [5].
Salinity causes reduced crop growth and yield loss because the plant must redirect energy from growing to extracting pure water from the saline water in the root zone [6]. High salinity causes both hyperionic and hyperosmotic stresses and can lead to plant death [7]. It is reported that plants growing under saline conditions are affected in three ways: reduced water potential in root zone causing water deficit, phytotoxicity of ions such as Na+ and Cl– and nutrient imbalance depressing uptake and transport of nutrients. Na+ competes with K+ for binding sites essential for cellular functions [8].
In most of the cases, the negative effects of salinity have been attributed by increase in Na + and Cl– ions in different plants hence these ions produce the critical conditions for plant survival by intercepting different plant mechanisms. Although both Na+ and Cl– are the major ions which produce many physiological disorders in plants, Cl– is the most risky [9]. Soybean has been displayed a broad spectrum of salt tolerance ability and the degree of their salt tolerance varied with the developmental stages and environmental factors [10]. Soybean is classified as a moderately salt-tolerant crop [11].
Soybeans production and its importance
According to Agricultural Survey 283459, 26 tons of Soybeans is produced from 14198.20 hectares of land (CSA, 2011) [12]. Ethiopia produced an estimated volume of 150,000 tons in 2014/15, from combined production of smallholders and commercial farmers. The growth in production is attributed mainly to the increase in area cultivated and productivity. The total area of land under soybean production during the last 10 years has increased tenfold, while the total volume of production during the same period increased 21 times [13].
Soybeans are used to make a variety of local foods, such as bread, chappati, porridge, soy milk, yoghurt as well as the traditional Ethiopian stew, Shero wot. Soybeans are also used to make corn-soybean blend (CSB) for emergency food assistance programs run by international organizations and the Ethiopian government (FAS/Addis Staff, 2016). Since the oil content is high (16% and above) Soybean is used for edible oil production in Ethiopia. In Ethiopia, particularly in the capital city, Addis Ababa, Faffa Food Share Company, East African flour factory, and Health care food manufacturing private limited companies, ETc, are using local and imported soybeans in the preparation of enriched food products for children and adults [14].
Climate, soil and fertilizer requirements of soybean
The suitable soybean production areas of Ethiopia have been indicated in areas with an altitude ranging between 1100 and 1850 m.a.s.l., with mean maximum temperature of less than 30˚C - 37˚C, mean minimum temperature greater than 10˚C - 12˚C. Soybean is considered as a main cash crop in many lowlands and mid-altitude zones of Ethiopia [15]. Fertilizer requirements of Soybean are 200 kg super phosphate and 150 kg Potassium Chloride per ha, Soybean is a capable of fixing atmospheric Nitrogen which meets its requirements for high yields [16]. Soybean (Glycine max) plays an important role in the global agricultural Nitrogen cycles by facilitating biological fixation of atmospheric N into plant-available N in symbiotic association with Bradyrhizobium. The N2 fixation potential of Soybean varies ranging from 0 to 185 kg N ha-1 with an average value of about 84 kg N ha-1. However, a starter dose of 10 to 20 kg/ha of Nitrogen (N) is beneficial for good early growth.
Deep, well-drained soil with a fine, fertile and has good waterholding capacity is needed for good soybean production. Soya beans are generally better adapted to heavier soils and better able to utilize water at lower soil depths than most other crops, including maize. Soybeans are better adapted to soil types with a lower pH than other legume crops, but a pH value lower than 5.2 affect nitrogen fixation. Compacted soils should be avoided because the hypocotyls of the soybean break easily during emergence. It is preferable to plant in moist soil, good seed-to-soil contact and formation of a soil crust at this time should be prevented (Department of Agriculture, Forestry and Fisheries, 2010).
Saline irrigation water
Salinity refers to the total concentration of dissolved salt in the soil and water. In many arid and semi-arid regions, most of the salts present in irrigation water are Chlorides, sulfates, carbonates, and bicarbonates of Calcium, Magnesium, Sodium and Potassium. Highly Saline and Sodic water qualities can cause problems for irrigation, depending on the type and amount of salts present, the soil type being irrigated, the specific plant species and growth stage, and the amount of water that is able to pass through the root zone [17]. Ayers and Westcot further indicates that given water is said to have salinity problem if its ECW is above 3 dS/m. Based on concentration of salt, water is classified into Freshwater, Slightly brackish, Brackish, Moderately saline, Saline and highly Saline. The classification is described in Table 1.
| Water designation | Total dissolved salts (mg /L) | EC (dS /m) |
|---|---|---|
| Fresh water | <500 | <0.6 |
| Slightly brackish | 500–1,000 | 0 .6–1.5 |
| Brackish | 1,000–2,000 | 1.5–3.0 |
| Moderately saline | 2,000–5,000 | 3.0–8.0 |
| Saline | 5,000–10,000 | 8.0–15.0 |
| Highly saline | 10,000–35,000 | 15.0–45.0 |
Many studies related to salinity have considered Na+ and Ca2+ cations and Cl- anions [18]. To correctly evaluate the effects of salinity on plants, we must first differentiate between low concentrations of salts that may well be beneficial to plant growth, even though they reduce osmotic potential and excessive concentration that have harm ful effects. A simple demonstration of some of the interacting osmotic and toxic effects is found with NaCl. Low levels of Na+ are beneficial and Clis essential to plant health [19]. The maximum irrigation water salinity tolerability of Soybean is 6.7 mmhos/cm or dS/m and the irrigation water salinity that Soybean is produce without yield reduction is up to 3.3 mmhos/cm or dS/m [20].
Saline water and crop productions
The most influential water quality guideline on crop productivity is the water salinity hazard as measured by electrical conductivity. The amount of water transpired through a crop is directly related to yield; therefore, irrigation water with high ECw reduces yield potential [21]. The primary effect of high ECw water on crop productivity is the inability of the plant to compete with ions in the soil solution for water which causes physiological drought. The higher the EC, the less water is available to plants, even though the soil may appear wet [22].
Salinity causes reduced crop growth and yield loss because the plant must redirect energy from growing to extracting pure water from the saline water in the root zone [6]. High salinity causes both hyper ionic and hyperosmotic stresses and can lead to plant death [7]. It is reported that plants growing under saline conditions are affected in three ways: reduced water potential in root zone causing water deficit, phytotoxicity of ions such as Na+ and Cl– and nutrient imbalance depressing uptake and transport of nutrients. Na+ competes with K+ for binding sites essential for cellular functions [8].
Dissolved Salts in the soil water inhibits crop growth and yield in two ways which are by osmotic influences and specific-ion toxicities. First, the presence of dissolved salt in the soil reduces the ability of the plant to take up water, and this leads to decrease plant growth. This is the osmotic or water-deficit effect of salinity. Second, excessive amounts of salt entering the transpiration stream will eventually injure cells in the transpiring leaves and this may further reduce growth. This is the salt-specific or ion excess effect of salinity [18,23].
Irrigation interval and crop production
Irrigation interval is one of the most important factors in irrigation scheduling, and a proper irrigation interval can establish moderate moist and oxygen conditions in the root zone throughout the crop period. Irrigating too frequently, results in a very humid region in the root zone, and root growth and function are affected by inadequate oxygen diffusion into the root zone. In addition, when the soil is too wet, the parenchyma cells in the xylem of root expand quickly, but the cells in the phloem and periderm cannot expand accordingly, and cause root cracking. On the other hand, too long irrigation intervals, results in dramatic fluctuations of soil moisture in the root zone, and bring about cyclic water stress on crop growth. When the soil moisture is lacking, the development of the root is restrained and the lignification’s of periderm is increasing. Subsequently, when the soil is wet, the root expands rapidly, but the cells in periderm cannot expand correspondingly, and then cause the root to crack. Therefore, both too high and too low irrigation frequencies are not good for crop production
Irrigation interval to prevent water stress was improving the chances for success when using higher salinity water. Proper Irrigation interval is important to reduce salinity and avoid water stress between irrigations. Water stress between irrigations can often be eliminated by increasing the frequency of irrigations, thereby preventing excessive root zone depletion caused by too long an interval between irrigations. By decreasing the interval between irrigations, higher soil-water availability is maintained. Increasing the frequency of irrigations may not always produce the desired results. Proper irrigation interval can play a major role in increasing the water use efficiency and the productivity by applying the required amount of water when it is needed. On the other hand, the poor irrigation interval can lead to the development of crop water deficit and result in a reduced yield due to water and nutrient deficiency [24]. Increasing the irrigation interval causes decreases in both shoot and root dry weights. The proper irrigation interval saves more water at the early growing stage of the plants. The proper irrigation interval which encourages root development in lower soil layers at the early growth stages is a practical tool to increase water use efficiency and to save more water [25].
Site description and climatic data
This experiment was conducted at Hawassa University research farm. Hawassa, also spelled Awassa is a city in Ethiopia, on the shores of Lake Awasa in the Great Rift Valley. It is located 273 Km south of Addis Ababa via Bishoftu, 130 km east of Sodo, and 75 km north of Dilla. The town serves as the capital of the Southern Nations, Nationalities, and Peoples' Region. It has latitude of 7° 3′N and longitude of 38° 28′E and elevation of 1708 meters above sea level.
Irrigation schedule (amount of water and time to irrigation) and crop water requirement was determined by using CROPWAT Model.
Inputs of cropwat model
Calculations of the crop water requirements and irrigation requirements were carried out with inputs of climatic, crop and soil data. The model required the following data for estimating crop water requirements (CWR) (Table 2).
| Month | RF (mm) | Minimum Temperature (°C) | Maximum temperature (°C) | Relative humidity (%) | Wind speed (Km/day) | Sunshine hour (hr) | ETo mm/day |
|---|---|---|---|---|---|---|---|
| Jan | 18.0 | 12 | 29.1 | 50 | 62.65 | 9.4 | 4.04 |
| Feb | 22.7 | 13 | 30.2 | 49 | 78.81 | 9 | 4.65 |
| Mar | 69.2 | 13.8 | 30.6 | 50 | 61.96 | 8.4 | 4.87 |
| Apr | 101.3 | 14.7 | 29.1 | 62 | 55.89 | 7.2 | 4.1 |
| May | 147.7 | 15 | 27.6 | 69 | 61.55 | 7.1 | 3.96 |
| Jun | 103.8 | 14.9 | 26.6 | 68 | 72.16 | 6.7 | 3.77 |
| Jul | 133.4 | 15 | 25.1 | 72 | 64.60 | 4.9 | 3.28 |
| Aug | 128.4 | 15 | 25.2 | 74 | 63.62 | 5.5 | 3.46 |
| Sep | 134.2 | 14.7 | 25.8 | 73 | 53.56 | 5.6 | 3.49 |
| Oct | 59.8 | 14.6 | 27.3 | 64 | 47.65 | 7.3 | 3.82 |
| Nov | 40.5 | 12 | 28.2 | 55 | 53.59 | 8.8 | 3.92 |
| Dec | 21.6 | 11 | 28.0 | 52 | 59.46 | 9.5 | 3.85 |
In order to calculate the reference evapotranspiration using the CROPWAT model, 11 years (2006-2017) of average monthly maximum and minimum temperature, relative humidity, sunshine hour, rainfall and wind speed data that was collected from Hawassa meteorology station which was prepared in Table 3 from monthly maximum and minimum temperature, relative humidity, sunshine hour, rainfall and wind speed of each year. Reference evapotranspiration (ETo) was determined by using FAO Penman-Monteith equation [26] from climatic dates that was collected from metrological stations.
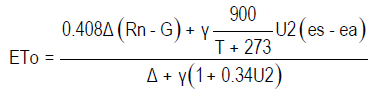 (1)
(1)
Where, ETo- reference evapotranspiration [mm day-1], Rn - net radiation at the crop surface [MJ m-2 day-1],
G - Soil heat flux density [MJ m-2 day-1], T - air temperature at 2 m height [°C],
U2 - Wind speed at 2 m height [m s-1], Es - saturation vapour pressure [kPa],
Ea - Actual vapour pressure [kPa], es- Saturation vapour pressure deficit [kPa],
Δ- Slope vapour pressure curve [kPa °C-1], Γ- psychrometric constant [kPa °C-1].
| Salinity level (S) | Irrigation interval (I) | ||
|---|---|---|---|
| I1 | I2 | I3 | |
| S1 (fresh water) control | S1 I1 | S1 I2 | S1 I3 |
| S2 | S2 I1 | S2 I2 | S2 I3 |
| S3 | S3 I1 | S3 I1 | S3 I1 |
| S4 | S4I1 | S4I2 | S4I3 |
Crop and soil data
A Crop data includes planting date, crop coefficient data files (including Kc values, stage days, root depth, depletion fraction) and length of individual growth stages. The Crop module requires crop data over the different stages: initial, development, mid and late stages [27]. Soybean crop was sown 02/02/2018 G.C. at the experimental plot. It had 30 cm effective root length, 90 days growth period required, and 50% critical depletion and was harvested on 02/05/2018 G.C. The Kc values of Soybean at initial, mid and late stages are Kcinitial (0.15), Kcmid (1.1) and Kclate (0.3), respectively [26]. Required soil data such as soil texture, maximum infiltration rate, bulk density and water retention at FC and PWP to determine total available soil moisture were measured and results were used as input for the software. The Total available soil moisture (TAW) was calculated as the difference in moisture content between water held at field capacity (FC) and permanent wilting point (PWP). The metrics potentials corresponding to FC (−1/3 bar) and PWP (−15 bars) were applied using the pressure plate apparatus. The gravimetric water content was converted into volumetric water contents using bulk density. The depth of TAW was calculated using [28] relationship.
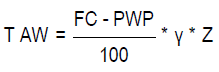 (2)
(2)
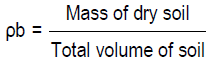
Where: γ specific gravity =ρb/ w (Dimensionless),
ρw - Density of water assumed to be 1 g/cm3,
ρb - Dry bulk density of the soil (g/cm3)
 (3)
(3)
Z =Depth of the root zone (mm),
After acquiring all the required data crop water requirements were calculated by using CROPWAT (8.0) software.
The software calculates the crop water requirement (ETc) as:
ETc = Kc * ETo (4)
Where, ETc - Crop Water Requirement
Kc - Crop Coefficient, ETo - Reference Evapotranspiration
Irrigation requirement and irrigation schedule
Irrigation requirement (IR) was determined by using ETc and effective rainfall, which is part of the rainfall that entered into the soil and made available for crop production. Generally, IR estimated from the equation.
R = CWR –Peff (5)
Where, IR= Irrigation requirement (mm),
CWR = Crop water requirement (mm) and
ü =Effective rainfall (mm) but, in this study effective rainfall was taken as zero
Therefore R = CW (6)
Net and gross irrigation requirement
The amount of irrigation water that needs to be supplied to the crop to compensate all evapotranspiration losses” (FAO, 2002) was determined by the equation
INIR = TAW × Z × P (7)
Where, NIR- Net irrigation required (mm)
P -Allowable soil moisture depletion of crop (50%)
TAW -Total available soil moisture (mm/m)
ETc value will be taken from equation 3 and TAW from Equation 1
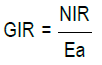 (8)
(8)
Where, GIR-Gross irrigation requirement (mm)
Ea –Application efficiency (take as 95%)
The irrigation intervals (I) in number of days were 3, 4 and 5 days. To determine irrigation interval use CROP WAT software based on yield reduction between 0% and 5%. Irrigation interval that 0% yield reduction is 3 days and 5% yield reduction is 5 days interval. Therefore, irrigation interval, which was used in the experiment, was 3, 4 and 5 days of irrigation interval. At the beginning of the growing period all treatments were irrigated with fresh water until the crops were established.
S1I1-fresh water 3dS/m with 3days of irrigation interval,
S1I2- fresh water with 4 days of irrigation interval
S1I3- fresh water with 5days of irrigation interval,
S2I1-4dS/m of water with 3 days of irrigation interval
S2I2-4dS/m of water with 4 days of irrigation interval,
S2I3 -4dS/m of water with 5 days of irrigation interval
S3I3-5dS/m of water with 5 days of irrigation interval,
S4I1-6dS/m of water with 3 days of irrigation interval
S3I1-54dS/m of water with 3 days of irrigation interval,
S3I2-5dS/m of water with 4 days of irrigation interval
S4I2 -6dS/m of water with 4 days of irrigation interval,
S4I3-6dS/m of water with 5 days of irrigation interval
Since there were 12 treatments and replicated 3 times, therefore 12 × 3=36 pots were used for the experiment (Figure 1).

Figure 1. Location map of the study area.
Yield data and statistical analysis
At harvest, all plants were taken to determine total number of pods per plant, number of seed per plant and grain yield. The various data collected were subjected to analysis of variance appropriate to factorial experiment in randomized complete design (CRD) using SAS software version 9.2 (SAS, 2008). Whenever the treatment effects were found significant, LSD test at 5% was performed to assess significant difference among treatments mean.
Irrigation schedule (amount of water and time to irrigate) and amount of salts in gm that were applied to made salinity level of 3, 4, 5 and 6 dS/m within three, four and five days of irrigation interval from initial to harvesting time were determined. Crop water requirement of Soybean was highest at mid stage from the other growth stage for all at three, four and five days of irrigation interval. While the crop water requirement was obtained at initial growth stage for all three, four and five days of irrigation interval compared to the other growth stage of Soybean (Tables 4, 5 and 6).
| Growth Stage |
ETo mm/day |
ETc mm/day |
ETc mm/period |
NIR mm/period |
Peff mm |
GIR mm/period |
IR mm/period |
|---|---|---|---|---|---|---|---|
| Init | 23.50 | 3.90 | 11.70 | 11.50 | 0.00 | 12.00 | 11.70 |
| Dev | 23.70 | 14.45 | 43.35 | 40.90 | 0.00 | 43.10 | 43.35 |
| Mid | 65.60 | 71.14 | 213.43 | 214.60 | 0.00 | 225.60 | 213.43 |
| Late | 25.46 | 18.42 | 55.27 | 51.80 | 0.00 | 54.40 | 55.27 |
| Total | 323.75 | 318.80 | 0.00 | 335.10 | 323.75 |
| Growth | ETo | ETc | ETc | NIR | Peff | GIR | IR |
|---|---|---|---|---|---|---|---|
| Stage | mm/day | mm/day | mm/period | mm/period | mm | mm/period | mm/period |
| Init | 18.60 | 3.16 | 12.65 | 12.40 | 0.00 | 13.05 | 12.65 |
| Dev | 19.04 | 15.71 | 62.84 | 50.10 | 0.00 | 52.74 | 62.84 |
| Mid | 46.86 | 51.03 | 204.13 | 204.50 | 0.00 | 215.26 | 204.13 |
| Late | 17.64 | 12.97 | 51.86 | 54.50 | 0.00 | 57.37 | 51.86 |
| Total | 102.14 | 82.87 | 331.48 | 321.50 | 0.00 | 338.42 | 331.48 |
| Growth | ETo | ETc | ETc | NIR | Peff | GIR | IR |
|---|---|---|---|---|---|---|---|
| Stage | mm/day | mm/day | mm/period | mm/period | mm | mm/period | mm/period |
| Init | 13.95 | 2.46 | 12.32 | 11.40 | 0.00 | 11.90 | 12.32 |
| Dev | 28.12 | 13.11 | 65.55 | 52.40 | 0.00 | 55.00 | 65.55 |
| Mid | 37.58 | 40.83 | 204.13 | 205.10 | 0.00 | 215.90 | 204.13 |
| Late | 17.22 | 11.46 | 57.32 | 55.70 | 0.00 | 58.60 | 57.32 |
| Total | 96.87 | 67.86 | 339.32 | 324.60 | 0.00 | 341.40 | 339.32 |
The laboratory analysis of Irrigation water showed that the salinity level and pH value of water that was used for irrigation in the experiment was found to be 3 dS/m and 7.56 respectively.
Effects of salinity on yield and yield component of soybean
The result of this study showed that the number of pods per plant was significantly affected by the salinity stress, irrigation interval and by the interaction of salinity and irrigation interval (p<0.001). The lowest seed filled pod number per plant (6.7) was observed from Soybean which was irrigated using salinity level four (S4) or 6 dS/m with irrigation interval three (five days) S4I3and the highest seed filled pod number (88.3) was recorded from Soybean which was irrigated within the first salinity level or fresh water (S1) with irrigation interval one (3 day) S1I1 (Figure 2).

Figure 2. Layout of the experiment.
The study also showed that irrigation with fresh water (S1) in interaction with (I1) increased number of pod per plant by 6.64% over four days of irrigation interval (I2) and 8.08% over five day of irrigation interval (I3), irrigation with 4 dS/m salinity level (S2) in interaction with three day irrigation interval (I1) increased number of pod per plant by 2.96% over four day irrigation interval (I2) and 5.18% over five day of irrigation interval (I3). The number of pod per plant was decreased by 15.03% and 20.23% for I2 and I3 treatments in compare to the I1 treatment in interaction with high salinity level treatment (S3). Also, the grain yield was decreased by 22.48% for I2 and 37.98% for I3 in compare to the I1 treatment in interaction with high salinity level of S4 (Figure 3).

Figure 3. Effects of saline water and irrigation interval number of pod per plant.
The reason for Salinity stress and irrigation interval encourage significant decrease in the number of pods due to the reduction of plant potential to uptake the water, Soybean plants were most sensitive to water stress or required more water during pod formation and seed filling period than from the other stage. The higher the EC and too long irrigation intervals in this stage, the less water is available to plants, dramatic fluctuations of soil moisture in the root zone, and bring about repeated water stress on crop growth, even though the soil may appear wet. Because plants can only transpire usable water in the soil solution decreases dramatically as EC increases.
The results agree with Khan et al. [5] who reported that decrease Number pods per plant due to salinity stress. These studies also agreed with Taffouo et al. [29] who reported that, the significant decrease of yield components under salt stress. The results also agreed with Shuqin Wan and Yaohu Kang who reported that reduce number of pod with increase of irrigation interval Nahar and Hasanuzzaman [30] also recorded different yield components were significantly affected by salinity and water stress. The reproductive growth was also affected by salinity as the number of pods per plant significantly decreased with increasing salinity levels.
Number of Seed per Plant of Soybean
The salinity, irrigation interval and interaction of salinity with irrigation interval showed highly significance (P< 0.001) effect on number of seed per plant.
The highest number of seed per plant (172.3) was recorded from (S1I1) which is irrigated by fresh water (S1) with irrigation interval one or (I1=3 days) irrigation interval, while the lowest number of seed per plant (12.67) was recorded from S4I3 which was irrigated by salinity level four (S4) with irrigation interval three (I3=5 day) (Figure 4). The result also showed irrigation with fresh water (S1) in interaction with (I1) increased the number of seed per plant by 10.97 and 11.97% over four (I2) and five day of irrigation interval (I3) respectively irrigation by fresh water with irrigation interval three (five days) decreased number of seed per plant by 1.81% over four days of irrigation interval. Irrigation by salinity level two with interaction of irrigation interval one increased number of seed per pod by 2.15% over interval two and 2.97% over irrigation interval three and irrigation by salinity level two water with interval two increase number of seed per plant by 0.8% over interval three. Irrigation by salinity level three with interaction of irrigation interval one increased number of seed per pod by 10.15% and 23.23% over irrigation interval two and three respectively. Irrigation by salinity level four with interaction of irrigation interval one also increased number of seed per pod by 7.20% over interval two and 30.79% over irrigation interval three and irrigation by salinity level four (S4) water with interval two increase number of seed per plant by 23.59% over interval three (Figure 5). The reason for decreased in the number of seed per pods within increased of Salinity and irrigation interval may due to increased irrigation interval causes to hold a altered moisture content in the soil. Thus, more of the salts are then kept in the soil and difficult for leaching process.

Figure 4. Effects of saline water and irrigation interval on number of seed per plant of soybean.

Figure 5. Soybean at late stage and harvesting time.
The study in line with Nahar and Hasanuzzaman [30] who studied that Number of pods per plant, seeds per plant and seed weight was negatively correlated with salinity levels Ghassemi-Golezani et al. [31] also reported reduction in seed yield of Soybean due to salinity stress. According to Muhammad and Hussain [32], disturbed water and nutritional imbalance of plants may cause reduced crop yield in saline conditions.
Grain yield of Soybean
The results of statistical analysis showed that irrigation interval, saline water and the interaction of salinity and irrigation interval had highly significance effect (p<0.001) on grain yield. The maximum grin yield 2.31ton/ha was obtained at the interaction of three days irrigation interval with fresh water (S1I1) and minimum grin yield 0.034 ton/ha was obtained at interaction of (13) five day of irrigation interval with high salinity level 6 dS/m (S4I3).
It is found that irrigation with fresh water (S1) in interaction with (I1) increased the grain yield by 10.5 and 14.6% over four (I2) and five day of irrigation interval (I3), respectively, irrigation with 4 dS/m salinity level (S2) in interaction with three day irrigation interval (I1) increased the grain yield by 9.2% over four day irrigation interval (I2) and 13.4% over five day of irrigation interval (I3). The grain yield was decreased by 15.9% and 20.2% for I2 and I3 treatments in compare to the I1 treatment in interaction with high salinity level treatment (S3). In addition, the grain yield was decreased by 13.8% for I2 and 40% for I3 in compared to the I1 treatment in interaction with high salinity level of S4 (Figure 6).

Figure 6. Soybean Seeds in R1, R2 and R3 samples.
The reason for decreasing of grain yield within increasing of irrigation interval with increasing of salinity level was due to concentration of salts in the root zone reduces soil water potential causing water deficit, phytotoxicity of ions such as Na + and Cl – and nutrient imbalance depressing uptake and transport of nutrients. Excess salt concentration also enhances the osmotic potential of soil matrix, which restricts the water uptake by plants. Consequently, plant cannot uptake water freely from the soil, and the deficiency of water causes reduction of yield. According to Lesley et al., [33] salinity stresses may reduce the seed filling rate and decrease grain filling duration. This can influence final yield of Soybean because final seed weight is the result of seed filling rate (Figure 7).

Figure 7. Effects of saline water and irrigation interval on Grain Yield (GY) of Soybean.
The results agree with Ayman El-Sabagh [34] who reported that the Weight of Seed decreased significantly under saline stress and irrigation interval on soybean crop. Grain yields reduction of rice varieties due to salt stress also reported by Linghe and Shannon [35] and Gain et al. [36]. These results substantiate findings of Kabir et al. and Ali et al. [37] who also noted similar effects of irrigation on grain yield while working on wheat crop. Erkan Boydak [38] also fined the highest yield in narrow irrigation interval in sesame crop.
In Ethiopia Soybean is cultivated mainly in the southern and western parts around Hawassa, Jimma, Bako, Pawe and Assosa. Now a day the quality of water is serious problem in all developing countries. In Ethiopia, there is a high saline ground water in some parts of rift valley including southern Ethiopia due to saline geothermal water. To enhance Soybean production and to take salinity management option, determination of salinity tolerance of Soybean at different irrigation interval through saline water is vital. Therefore, this study was conducted to determine the effects of saline water and irrigation interval on yield of Soybean.
The analysis of the study showed that, there were significant differences on the Soybean grain yield, number of seed per plant and number of pod per plant under different irrigation intervals and salinity level. Grain yield, number of seed per plant and number of pod per plant in treatment S1I1 were 2.313 ton/ha, 172.33, and 88.33 respectively. On the other hand minimum grin yield (0.034 ton /ha), minimum number of pod per plant (6.67) and number of seed per plant (12.67) were found in treatment S4I3. When highly saline water is used for irrigation, it is recommended to use short irrigation interval (3 days interval) instead of applying irrigation every 4 or 5 days. However, the short irrigation interval practice normally reduces the plant stress under saline irrigation. To control leaching problem and minimize cost the experiment was done by using pots. Hence, field experiment should be done to better understand the effects of salinity levels and irrigation intervals on yield before recommending to farmers.
Journal of Civil and Environmental Engineering received 1798 citations as per Google Scholar report


