Research Article - (2024) Volume 12, Issue 2
Received: 21-Mar-2023, Manuscript No. JND-24-130322;
Editor assigned: 24-Mar-2023, Pre QC No. JND-24-130322 (PQ);
Reviewed: 09-Apr-2023, QC No. JND-24-130322;
Revised: 21-May-2024, Manuscript No. JND-24-130322 (R);
Published:
29-May-2024
Citation: Alizadeh, Golamali, Tohidy Yousefi Rezaii and Saeed
Meshgini. "Epileptic Seizure Prediction Using One Channel EEG Signal and 2
D-Convolutional Neural Networks." J Neurol Disord 12 (2024): 585.
Copyright: © 2024 Alizadeh G, et al. This is an open-access article distributed under the terms of the creative commons attribution license which permits unrestricted
use, distribution and reproduction in any medium, provided the original author and source are credited.
Purpose: Epilepsy is a neurological disorder affecting more than 55 million people worldwide. Predicting epileptic seizures will improve the lives of people with epileptic seizures. Currently, the diagnosis of an epileptic attack and the analysis of recorded brain activity is performed by a neurologist, which is often accompanied by human error. Recently, researchers have been looking to design and build an automatic system to detect and estimate the occurrence of epilepsy.
Methods: In the present study, two new-fangled methods were proposed based on brain signals and a Convolutional Neural Network (CNN). In this research, Pulse Width Modulation (PWM) is used to create features.
Results and conclusion: Numerous experiments were performed and the accuracy of estimating epilepsy of the proposed methods was achieved in 100%. The proposed methods were more accurate than the previous methods and can be employed as a physician's assistant once entering the field of operation.
Epilepsy • Electroencephalogram • Convolutional neural networks • Pulse Width Modulation (PWM)
Epileptic disorders affect more than 50 million people worldwide, and antiepileptic drugs are not a definitive treatment solution [1]. This disease is controlled by medicine in mild cases and surgery in severe cases. However, there is no definitive cure for this disease in the world [2]. Epilepsy patients face many problems in daily life, such as driving, sleeping, and doing everyday activities [3,4]. Therefore, predicting the onset of an epileptic attack is a significant help for people with epilepsy [5]. The Electroencephalogram (EEG) method is a strong, simple, accurate, and relatively low-cost method to study the details of brain signals. In this method, the electrical voltages of the brain change surprisingly to feel the patient's condition [6]. The system shown in Figure 1 will help patients with epileptic attacks in different life situations, such as driving, sleeping, and other daily conditions [7]. By using the above device, the patient alone can prevent epileptic attacks by taking medicine and refraining from dangerous activities such as driving, swimming, walking on the side of the road, etc. [8-10].

Figure 1. Wrist watch. Wearable device for epileptic patients which gives alarm during pre-ictal state.
In the methods of estimating and diagnosing epileptic attacks, the signals of patients with epilepsy are divided into three classes: ICTAL, INTERICTAL, and PERICTAL. In addition, in the classifiers section, various types of classifiers such as Support Vector Machine (SVM), Sparse Representation Classifier (SRC), K-Nearest Neighbor (KNN), and Multilayer Perceptron (MLP) are used [11-13].
In older methods, statistical features, including mean, standard deviation, median, irregularity, elongation, skewness, and signal energy, were used as features before the classifier [14-16]. In order to detect changes in EEG in the per-ictal state, various features of EEG time series such as permutation entropy, rat models of absence epilepsy, Kolmogorov entropy, correlation dimension, and relative wavelet energy have been used in different algorithms, which can Estimate of an epileptic attack were five seconds before the onset of the seizure [17-20]. In recent studies, the use of CNN in diagnosing and estimating epileptic seizures has been widespread. In these methods, functions have been used to increase accuracy to create features before the deep neural network. The use of such operations has significantly increased the accuracy of the methods from 58% to about 92%. The most important of these functions are Principal Component Analysis (PCA), Independent Component Analysis (ICA), the Fast Fourier Transform Function (FFT), time-frequency domain conversion, Fourier transform, and Local Mean Analysis (LMD) [21-25]. The Long Short-Term Memory Neural Network (LSTM) is one of the famous deep neural networks used in 23-channel and single-channel to estimate and diagnose epileptic attacks [26,27]. In most recent research, to increase the accuracy of the presented algorithms. Functions such as the frequency spectrum and the time frequency have been used before LSTM deep neural network [28]. In this article, according to the portable warning systems and estimation and diagnosis systems in hospitals, a high-performance, Low-computational load algorithm that can be used in industrial microprocessors with limited memory is presented.
The present study presented a new method based on a single-channel EEG signal and convolutional neural network. Also, data integration of several volunteers was used to generalize the seizure estimation system and provide a new algorithm. Considering the industrial processor memory available in portable seizure estimation systems and the increase in the system's accuracy, pulse-width modulation was used to extract features from the brain signal.
Data
In this study, brain signals were obtained from the Massachusetts Institute of Technology (MIT, USA) database containing data from 14 participants with 23 channels at a sampling frequency of 256 Hz. Table 1 shows the data characteristics of patients participating in this research. Nine of the 14 participants were female, and five were male. The age range for females and males was 3-10 and 3-20 years, respectively. The onset and ending time of the epileptic seizure were determined for each selected data, which differed for each participant. In addition, brain signals with a sampling time of 1 second were divided into pre-ictal and inter-ictal classes. Table 1 shows the characteristics of patients participating in this research.
| Duration of seizure (min) | Duration of recordings | # of seizure | Age | Sex | ID |
|---|---|---|---|---|---|
| 7.37 | 40:33:08 | 7 | 11 | F | 1 |
| 2.87 | 35:15:59 | 3 | 11 | M | 2 |
| 6.7 | 38:00:06 | 7 | 14 | F | 3 |
| 6.3 | 156:03:54 | 4 | 22 | M | 4 |
| 9.3 | 39:00:10 | 5 | 7 | F | 5 |
| 2.55 | 66:44:06 | 10 | 15 | F | 6 |
| 5.42 | 67:03:08 | 3 | 14.5 | F | 7 |
| 15.32 | 20:33:08 | 5 | 3.5 | M | 8 |
| 4.6 | 67:52:18 | 4 | 10 | F | 9 |
| 7.45 | 50:01:24 | 7 | 3 | M | 10 |
| 13.43 | 34:47:37 | 3 | 12 | F | 11 |
| 24.58 | 23:41:40 | 40 | 2 | F | 12 |
| 8.92 | 33:00:00 | 12 | 3 | F | 13 |
| 2.82 | 26:00:00 | 8 | 9 | F | 14 |
| 33.2 | 40:00:36 | 20 | 16 | M | 15 |
| 1.4 | 19:00:00 | 10 | 7 | F | 16 |
| 4.88 | 21:00:24 | 3 | 12 | F | 17 |
| 5.28 | 35:38:05 | 6 | 18 | F | 18 |
| 3.93 | 29:55:46 | 3 | 19 | F | 19 |
| 4.9 | 27:36:06 | 8 | 6 | F | 20 |
| 3.32 | 32:49:49 | 4 | 13 | F | 21 |
| 3.4 | 31:33:08 | 3 | 9 | F | 22 |
Table 1. The data characteristics of participants.
Convolutional neural network
CNN is one of the deep neural networks introduced in 1998. In recent years, most researchers have used CNN to diagnose and predict epileptic attacks. CNN configurations are frequently one-dimensional, two-dimensional, and occasionally three-dimensional, depending on the neural network input. The neural network described above is well-suited to large-scale data. This research applied the input data to the neural network as an n × m image. It consists of three main layers: The convolutional layer, the max pooling layer, and the fully connected layer. The following sections describe the structure of each layer.
Convolution layer: A kernel was used in the convolutional layer to sweep the input images into the neural network. The dimensions of the kernels varied according to the design and were selected as 3 × 3 and sometimes 5 × 5. In the above layer, images were created from the input image based on the number of selected filters as a feature. The number of filters selected in most neural network architectures is typically 32. But in this study, to reduce the computational load, after a trial and error, 4 filters were selected. In summary, the function of the conventional layer can be expressed by equation 1, which is znin the input matrix and zjout output matrix of the conventional layer:
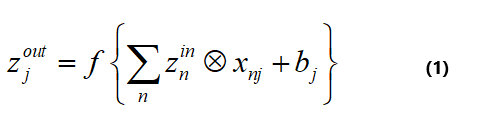
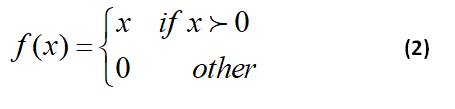
Where xnj and bj are the convolution filters between the n-th offset matrix of the neurons corresponding to the j-th output map. In this regard, f is a nonlinear activation function. The popular activation functions include sigmoid, tanh, and rectified linear units (ReLU). In the present work, ReLU is selected for the activation function, and equation 2 shows the ReLU function.
Max pooling layer: The max pooling layer reduced the dimensions of images produced by the convolution layer since their dimensions were halved. Equation 3 shows the rule of the max-pooling layer.

Fully-connected layer: When convolutional and maximum pooling operations were performed, the input images were displayed in pixels and represented as vectors in the fully connected layer. Then, the created vector was used for the final decision.
Proposed method
The block diagram shown in Figure 2A has recently been used to estimate the occurrence of an epileptic attack. This paper presented a simple, low-cost, high-performance algorithm for portable warning systems and epilepsy attack estimation systems in hospitals. Furthermore, before CNN, PWM was used to create the feature. The block diagram in Figure 2B shows the algorithm of the proposed method. A 23-channel signal is first converted into a single-channel signal by an averaging circuit, and then the resulting signal is compared with a ramp signal with a frequency of 6000 Hz. If the ramp wave amplitude exceeds the brain signal wave, the output will be positive VCC in the comparator. Otherwise, the result of the comparator circuit will be equal to a negative VCC. In this technique, the comparator circuit outputs high-resolution positive and negative pulses in response to electrical changes, such as the brain signal's amplitude, frequency, and phase.

Figure 2. Basic proposed method blocks diagram (2A) Block diagram of the proposed generalized method (2B).
Data preprocessing: In this research, the PWM signal is created after sampling one second of the average signals of 23 channels and comparing it with the ramp signal (Figure 3). As shown in the Figure above, the brain signal is indicated by blue color, the ramp signal by red color, and the output signal by green color. The PWM part compares the brain signal with the ramp signal, and depending on the amplitude of the two signals, the output is either +VCC or -VCC. In the following, the PWM signal is generated for the pre-epileptic and normal states. This signal is then converted into images similar to Figure 4B for deep neural network (CNN) training. Figure 4A demonstrates that the images produced by the above mapping exhibit only one direction of change. This means that the images do not change in the vertical direction. Therefore, it is possible to reduce the dimensions of images for neural network training. In other words, Figure 4A is a 256 × 256 matrix with equal rows but different columns. Consequently, a row of the 256 × 1 matrix is selected, and the above vector is shown in a 16 × 16 matrix. In general, images with dimensions of 256 × 256 are converted to images with dimensions of 16 × 16, which reduces the size of portable system memory. That is, a small amount of memory is required to store images. It should be noted that the MATLAB software command "imagesc(A)" was used throughout this study to display images of the above signals. This command displays the 256 × 1 matrix as a 256 × 256 image.

Figure 3. The PWM signal is created from the average signals of 23 channels.

Figure 4. PWM of pre-ictal and inter-ictal images (4A); converted images to 16 × 16 (4B).
Proposed neural network architecture: This study used a CNN with the structure shown in Figure 5 to extract features from images produced by the proposed function and the final decision. A trial and error approach was employed to obtain the above structure, and the precise characteristics can be found in Table 2. This structure consists of 3 main parts, including the convolution layer, max pulling layer, and the fully-connected layer for final decision-making. Convolution of the input images was performed using a 3 x 3 mask, followed by passing the results through the ReLU function. The convolutional neural network produced 4 images with dimensions of 16 x 16 from an input image of 16 x 16. In the max pooling section, a down-sampling operation was performed on the above-stated images, and images with 8 × 8 dimensions were produced. The dimensions of the input and output images of this section are shown in Table 3. In the above deep neural network architecture, the results obtained from the convolutional neural network included 256 pixels. For the final decision, however, only 128 significant pixels were selected for the fully-connected layer.

Figure 5. Convolutional neural network configuration.
Parameter |
Search space |
Optimal value |
|---|---|---|
| Optimizer | RMSProp, Adam, Sgd, Adamax, Steplr, Cycliclr | Sgd |
| Cost function | MSE, Cross-entropy | Cross-entropy |
| Dropout rate | 0,0.2,0.3,0.4,0.5 | 0.2 |
| Batch size | 4,8,10,16,32,64,100 | 4 |
| Learning rate | 0.01,0.001,0.0001 | 0.0001 |
| Momentum and gamma parameters | 0.6,0.7,0.8,0.9 | 0.9 |
| Decay rate of the weights | 2e-4, 3e-4, 4e-4, 5e-4, 6e-4 | 5e-4 |
| Activation function after the BN layer | Leaky-Relu, Sigmoid, Relu, Linear | Relu |
| Activation function in the first FC layer | Leaky-Relu, Sigmoid, Relu, Linear | Relu |
| Activation function in the last layer | Softmax, Sigmoid | Softmax |
Table 2. Convolutional network architecture.
| Convolutional network architecture | Filter dimensions | Input image dimensions | Dimensions of the output image of the convolutional floor | Dimensions of Max Pauling floor output image | Number and dimensions of the output image |
|---|---|---|---|---|---|
| First floor | 3 × 3 | 16 × 16 | 8 × 8 | 4 × 4 | 16 at (4 x 4) |
Table 3. Convolutional network architecture.
Data collection training and evaluation: Here, the data of individuals were first categorized into two modes, Pre-ictal and Inter-ictal, with a sampling time of one second. Afterward, the data were separately tested with the proposed method. As a next step, 6 participants whose epileptic seizures were longer than the others were selected from the data of 14 participants. The experiment was initially performed without using the PWM function, as in the block diagram shown in Figure 6A. Next, the data of 6 volunteers were merged with 2560 samples from each patient to estimate epileptic attacks. The data of the 6 participants were then combined using identical and non-identical integration methods, as shown in Figure 6B. In the identical merge mode, 2560 samples were selected equally from 6 participants for each mode, pre-ictal and inter-ictal. Finally, 15360 sample images were collected for each mode (30720 images in total). Figure 7 specifies the selection process of the test ratio to the above-stated training. The non-uniform merging mode involved selecting data randomly from each individual based on a different number of samples for each mode. The test-to-training ratio of 20% to 80% was selected for the identical and non-identical merges and independent review of each participant's data, respectively.

Figure 6. Blok diagrams of data integration system (6A); Initial PWM function (6B).

Figure 7. How to test and train the convolutional neural network.
In this study, data on individuals suffering from epileptic attacks were downloaded from the CHB-MIT website, and signals were divided into normal and pre-epileptic states. Then, the block diagram shown in Figure 4B was used to create the necessary images for CNN neural network training. The algorithm was 99% accurate for all data tested in the proposed method. Moreover, further experiments led to the development of two new methods to create a general method. These methods integrated data from six volunteers in identical and non-identical ways to train the neural network. Similarly, the data from six volunteers were used to train the neural network using a non-identical data integration method. The accuracy results of the algorithm were 99% for both identical and non-identical integration methods.
In this study, first, the brain signals of people suffering from epileptic attacks were downloaded from the CHB-MIT website. Data from six volunteers were selected for further analysis among the downloaded signals. The Inter-ictal and pre-epileptic state signals were selected for each person with an epileptic attack. At first, an individual test was conducted on each downloaded data. The tests were conducted using the block diagram shown in Figure 2B. Then, the data of both Inter-ictal and pre-epileptic states were converted into 16 × 16 images using the above block diagram. These images were used for CNN neural network. The results of the tests were impressive, and a noticeable increase in accuracy was achieved compared to previous methods. Further experiments were conducted using the identical and non-identical integration of data from six volunteers to create a general system, and the results were far from what was expected. This algorithm presents a valuable method of designing and constructing a detector and estimator of the occurrence of epileptic attacks. It has the advantage of reducing processing time and memory requirements. Its processing time is approximately 48 times faster than the prior methods. Of course, it is worth mentioning that in previous methods, functions such as FFT, DCT, PSD, and frequency-time have been used to extract features. Due to the reduction in image dimensions and using a single-layer CNN neural network, this algorithm significantly reduces the amount of processor memory required. In addition, the amount of memory required for storing data and commands in the system is reduced by 256 times. The above algorithm can therefore be implemented on microprocessors with limited external memory.
Pre-epileptic seizure detectors based on the EEG signal are not widely used due to their high cost. Also, no specific device is available in medical centers to detect epileptic seizures accurately. The design and industrialization of a simple, inexpensive system can have many benefits, including improved quality of life for people prone to epileptic attacks. Experimental tests were conducted in this study to compare the performance of the PWM approach with other methods. In the above method, the extraction of complex features is avoided, and the simple CNN deep neural network structure is used. We performed individual tests and data integration using CHB-MIT data to assess the proposed method's accuracy. The results demonstrate that the proposed method provides greater accuracy than previous methods. It is worth noting that the system was designed with only a simple CNN deep neural network in order to reduce processing time and memory requirements.
The authors declare that no funds, grants, or other support were received during the preparation of this manuscript.
The authors have no relevant financial or non-financial interests to disclose.
All authors contributed to the study conception and design. Material preparation, data collection and analysis were performed by Golamali Alizadeh, Tohidy Yousefi Rezaii and Saeed Meshgini. The first draft of the manuscript was written by Golamali Alizadeh and all authors commented on previous versions of the manuscript. All authors read and approved the final manuscript.
This is an observational study and no ethical approval is required.
All authors confirm that this study uses valid ready-made datasets available in Internet databases, which are mentioned in the text of the article.
In this research, the data set available on the Internet has been used, which is mentioned in the text of the article.
Signed by all authors as follows: Golamali alizadeh, Tohidy Yousefi Rezaii, Saeed meshgini
[Crossref] [Google Scholar] [PubMed]
[Crossref] [Google Scholar] [PubMed]
[Crossref] [Google Scholar] [PubMed]
[Crossref] [Google Scholar] [PubMed]
[Crossref] [Google Scholar] [PubMed]
[Crossref] [Google Scholar] [PubMed]
[Crossref] [Google Scholar] [PubMed]
[Crossref] [Google Scholar] [PubMed]
[Crossref] [Google Scholar] [PubMed]
[Crossref] [Google Scholar] [PubMed]
[Crossref] [Google Scholar] [PubMed]
[Crossref] [Google Scholar] [PubMed]
[Crossref] [Google Scholar] [PubMed]
[Crossref] [Google Scholar] [PubMed]
[Crossref] [Google Scholar] [PubMed]
[Crossref] [Google Scholar] [PubMed]
[Crossref] [Google Scholar] [PubMed]
[Crossref] [Google Scholar] [PubMed]
[Crossref] [Google Scholar] [PubMed]
Neurological Disorders received 1343 citations as per Google Scholar report