Research - (2021) Volume 10, Issue 3
Received: 08-Mar-2021
Published:
29-Mar-2021
, DOI: 10.37421/2162-6359.2021.10.586
Citation: Nwoloziri, Chinyeaka Nwokodi, Kenneth Ezebunwa Ndubuisi and Ebere Nwabueze. “Evaluation of impact of effective cargo distribution on Nigerian economy”. Int J Econ Manag Sci 10 (2021): 586.
Copyright: © 2021 Nwoloziri NC, et al. This is an open-access article distributed under the terms of the creative commons attribution license which permits unrestricted use, distribution and reproduction in any medium, provided the original author and source are credited.
This study is an evaluation of impact of effective cargo distribution on Nigerian economy. The rate of unemployment, inflation and high cost of living in Nigeria is becoming alarming. The study is aimed to determine the rate of increase in GDP; effective cargo distribution in Nigeria economy; and the relationship between the dependent and independent variables as used in this study. The data collected on this study are from secondary source online World Bank annual reports. Standard deviation and regression analyses were relevant tools used for data evaluation. The findings of the study identified economic recession, inadequate production of goods, services and low capita income. The standard deviation of Nigeria GDP is below the arithmetic mean which implies that enough goods and services are not produced to spread out over the increasing population. There is effective cargo distribution to the Nigerian population, the standard deviation on GDP per capita shows a well spread out of the data points which signifies that goods and services are properly distributed to the increasing population. The regression analyses tables show that the independent variable explains 74% of the variance of the dependent variable. The f-value is 1.201, and the corresponding significance level is 0.290, hence, the independent variable influences the dependent variable. The regression equation given in this analysis shows that a unit increase in the independent variable will respond to increase in the dependent variable. Therefore, this can be used as a model for benchmark to improve economic growth and development in the Nigerian economy.
Evaluation • Impact • Cargo distribution • Nigerian economy
Distribution is the activity of both selling and delivering products and services from manufacturer to consumer. Cargo distribution is one of the primary roles of any country’s logistics industry. Logistics industry plays major functions in different stages of production processes. At the initial, it helps in sourcing and moving raw materials to various plants where they are needed and at the end of production to distribute the semi-finished and finished products of goods and service to markets to ensure spatial circulation to the populace in order to enhance economic growth and development of the nation.
Logistics industries globally, has in recent time witnessed great development largely due to competition, industrialization, advance in technology, globalization, and sudden increase in world population which results to increase in demand and supply of industrial goods and services. Logistics industry can be regarded as the veins through which the lifeblood of any nation’s economies flows. Production arguably can be assumed to sustain an economy but without the transportation function of the logistics industry there will be no efficient distribution of finished products and providing raw materials for further production would be impaired. Therefore, Logistic activities are extensively important for manufacturing and trade sectors of the economy. Manufacturing corporations procure raw materials, process these raw materials into semi-finished and finished products which are distributed to the end users via the transportation function of logistic industries.
Logistics is rather a comprehensive concept. Although the concept is considered with an emphasis on transportation and its uses have been of great importance mostly in this era of industrialization, liberalization and globalization. Generally, logistics reflects the processes of the flow of information from the point of origin of raw materials to the point where these finished products (goods and services) reaches the final consumers. According to planning and controlling this process both in a productive and low-cost manner via storage and inventory facilities involves efficient transportation operations. In this context, logistics includes several types of services. The fundamental services include transportation, customs clearance, storage, handling, insurance, packaging, stocks and inventory management, however, this study is centered on effective cargo distribution which focuses more on transportation function of logistics industries [1].
Statement of the problem
Effective cargo distribution is very paramount to economic growth and development in every part of the world. Efficient transportation systems however, play the key roles in distribution of goods and services in the economic system. In this era of globalization, industrialization and commercialization, with rapid increase in population, it is expected that industries would produce more goods and services worth billions of dollars which need to be distributed across the nation. Effective distribution implies that these cargoes are supplied to consumer markets where they are made available to the final consumers and in turn the producers would be willing to produce more goods and services as consumer demands are increasing daily. Most importantly, as more goods and services are produced and distributed effectively across the population, the gross domestic product (GDP) increases with growth in economic activities (job creation, Employments, and increase earning) which inevitably would reflect on per capita income and purchasing power of the citizens. Economic development sets in when the standard of living of the people increases as a result of increase in per capita (resulting from increased GDP) which enables the people to invest in self-development, social amenities and consequently reduces poverty rate. Notwithstanding, in the recent years between the periods 2001-2017, Nigeria has witnessed high rate of unemployment or redundancy amounting to 70% with increasing poverty which has called for attention and necessitate the evaluation of effective cargo distribution on Nigerian economy in order to evaluate the impacts of effective cargo distribution on Nigerian economy for the periods 2001-2017.
Objectives of the study
The study is focused on the evaluation of impacts of effective cargo distribution on the Nigerian economy. The researcher tends to examine the following:
➢To examine if there is significant increase/growth on gross domestic product between the periods 2001-2017.
➢To examine if there is significant increase/growth in the cargo distribution in Nigeria for the periods 2001-2017.
➢To determine the relationship between the dependent and independent variables for the periods 2001-2017.
Research question
➢Is there significant increase/growth on gross domestic product between the periods 2001-2017?
➢Is there significant increase/growth in the cargo distribution in Nigeria for the periods 2001-2017?
➢What is the relationship between the dependent and independent variables for the periods 2001-2017?
Hypotheses
➢Ho1: there is no significant increase/growth on gross domestic product between the periods 2001-2017.
➢Ho2: there is no significant increase/growth in the cargo distribution in Nigeria for the periods 2001-2017.
➢There is no significant relationship between the dependent and independent variables for the periods 2001-2017.
Nigeria transport system
For the past decade, Nigeria has moved round erratically on the Logistic Performance Index (LPI) and is currently ranked 90 out of 160 countries in the world [2]. The index takes into consideration six factors – customs, infrastructure, international shipment, logistics competence, timeliness, tracking and tracing-that assess the ease with which goods move from producer to consumer. Multinationals and local companies look to increase their market presence in Nigeria. Hence the top priority for executives is to understand the distribution network within the country. Nigeria could be a very challenging market to navigate for any business looking to get its products in the hands of the Nigerian consumers, it is important to understand how transportation in Nigeria works – from the factories and industries to the domestic markets or warehouses is very vital, although the distribution of goods and services in Nigeria depends majorly on road transport network. There is a small percentage of distribution that occurs by rail and air [3]. The railway system offers freight train operations covering 280 station in 19 out of the 36 state in Nigeria. The rail network is comprised of eight lines with an overall length of more than 3500 km. Although a good rail system can reduce the cost of transporting goods across the country, the current rail network is sub-standard and underutilized. There is also an underutilization of air transport as a mode to move goods within the country due to high costs. There are about 22 airports within the country of which thirteen are designated as cargo airports; this offers the opportunity to increase the timeliness of delivery with more efficient transportation by air. However, in the recent time, both rail and air transportation has been attracting private and government investments for development that can potentially reduce transportation cost for businesses [2].
Notwithstanding, in Nigeria, the road network is very important in distribution of goods and services, this is because road transport accounts for over 90% of freight and passenger services for inland transportation with such a high percentage of goods transported by road, the importance of the road network to businesses cannot be over-emphasized [2]. The Nigerian road network has an estimated length of 200,000 km of which 18% is owned by the federal government, 16% owned by the state government and 66% (mostly earth roads, unpaved) are owned by the local government. The federal roads constitute only 18% of the road network but carry over 70% of the vehicular traffic [4]. Although the road network provides a broad national reach, the condition of the roads varies between good, fair and poor across the country – the bad roads are among the major challenges of distribution. There has been a recent push to improve the road networks in Nigeria as the road infrastructure has seen decades of neglect and only 15% of the total road network has been constructed in the last 55 years [4]. The biggest issue hindering the continuous development of the road network is the abandonment of construction projects by contractors that were not adequately funded to complete projects. A steady flow of investment into the road infrastructure can significantly ease the distribution of goods, leading to a boost in economic growth and development in the country. Nigeria is no different from other frontier markets that struggle with inadequate infrastructure. Bad roads significantly increase transportation cost for distributors. This cost of transportation is further increased because of a fragmented market that is not always connected to the major road networks. So depending on the products and where the customers are, the distribution challenges are heightened when the consumers are not in major cities and is not connected to the major road networks. Hence, difficulty navigating bad roads makes distribution more challenging in Nigeria.
The next challenge of efficient cargo distribution is storage and inventory management. Some distributors do not have the appropriate warehouse infrastructure for the products that they distribute. For instance, perishable goods that have to be stored in cold rooms will suffer from the inconsistent power supply that affects every Nigerian business. Because of high storage cost, some distributors outsource their warehousing, exposing their partners to additional risk. There is also a lack of visibility into the market because distributors lack the required information technology infrastructure, making it difficult for management to keep proper track of stock levels and to share information with partners in the market. Furthermore, the concentration of industriesand factories in one particular state or city centers accounts for challenges in distribution of cargoes and high cost of living in other areas of the economy. For instance, in Nigeria there is high concentration of industries and factories in the heart city of Lagos state, Port Harcourt, Aba and Onisha where all operations and productions are carried out and distributed to other parts of the economy which invariably put the other side on high demand and consequently high cost of goods and services. These problems necessitate the study on evaluation of effective cargo distribution on Nigeria economy.
Logistics performance index of Nigeria
Production is the creation of goods and services, these goods and services can be produced in factories and industries which are stored in warehouses. However, production cannot to be said to have been completed until the products/goods and services are distributed to end users or consumers. This is done through the logistics process which completes the production cycle. The distribution activity is equally referred to as ‘Physical Distribution Management’ (PDM), marketing logistics or physical flow. Physical distribution is the collective term for series of inter-related functions (primarily transportation, stockholding, storage, goods handling and order processing) involved in the physical transfer of finished goods from producers to consumers, directly or through intermediaries. Physical distribution explains the problem of getting the right quantity of the right product to the right place at the right time and at the least cost possible, this problem has confronted companies with challenges like meeting delivery due dates and operating an efficient distribution network [5].
For instance, he noted that consumer goods companies, with their great diversity of customers spread over vast geographical areas must integrate the systems components of distribution network to achieve an acceptable customer service level and avoid reduction in market share [6]. Geographically imposed gaps between firms and their potential consumers is bridged by transportation function of logistics industry to provide time and space utility between the two parties the continuous increase in the cost of transportation due to poor nature of our roads, high cost of transport infrastructures-vehicles and spare parts and currently increasing cost of petroleum products poses a serious problem to an effective coverage of territories in the distribution both in rural and urban areas in the country [7]. Distribution is becoming a more imperative issue in company budget as the cost of transport; warehousing and stockholding were growing relative to the costs of other industrial inputs. Marketing efforts, such as the extension of product lines and penetration of new marketing channels into new markets, were imposing increasing strain on distribution systems, making them more complex to manage and more expensive to operate [3,8].
Industrialization and globalization effects on national lo- gistics performance
Observed that globalization and industrialization have prompted an expanded requirement in the logistics industries globally which poses challenge on effective operation of the industry in the distribution of goods and services. Study on Logistics Performance Index (LPI) on the economy of Nigeria, Ghana and Morocco, the comparative analysis conducted, using the six components of LPI provided in the World Bank kit tool shows that Morocco has the best LPI, followed by Ghana, and Nigeria was the least. In this analysis, great importance was placed more on the infrastructure and followed by the services of the experts (transport industry). Factor like timeliness has the least importance, and therefore was assigned the lowest weight [3].
“Logistics as the careful planning, organizing, and controlling of all necessary activities in the material flow, beginning from the raw material up until the final consumption and reverse flows of the manufactured product, with the aim of satisfying the customer’s needs and wishes” [9]. It is common information that logistics coordination is that significant bit of the system of production that makes arrangements, plans, executes and controls the compelling movement of products and endeavors from the point of commencement to the point of use or utilization in order to meet the essential needs set by the customer. Activities encompassing logistics management ordinarily incorporate inward and outward transportation management, fleet coordination, materials harnessing, request satisfaction, network configuration, stock administration, supply/demand arranging and the management of suppliers. It further incorporates sourcing and acquirement creation arranging and scheduling bundling and gathering. “Logistics management is an incorporating capacity which cautiously assembles and advances all logistics exercises with different capacities including advertising deals assembling account and data innovation.
Logistics is an unpredictable succession of facilitated exercises. The execution of logistics relies upon open elements such as – the governments for the framework; the Logistics administrators, and the help of cross fringe business [10]. Being of global pertinence, the field of logistics and transport demonstrates its significance in every industrialized Nation.
Proficient logistics administrations encourage the portability of items, guaranteeing their well-being and speed just as decrease in cost when exchanging them among nations. “characterizes logistics as a major aspect of the value chain which plans, actualizes and controls the proficient progression of products, administrations and data from source to consumer”[11]. Eventually, the significance of logistics lies in the capacity to proficiently explain transportation, stockpiling and bundling issues, expanding the aggressiveness of organizations and the nation when all is said and done.
The globalization and industrialization impact of logistics industries is anchor on the competitiveness of the industry globally on efficient distribution of cargoes. Therefore, each country of the world engaging in global trade ensures advancing their technologies and knowhow in order to operate favorably in the global and national markets.
Transport a derived demand
Although, the demand for transport is considered a derived demand, this is because demands for use of transport facilities (railway, highway and waterway modes) are derived from production and distribution technology. This is an economic term, which explains a demand for one good or service which occurs as a result of demand from another. Users of transport are primarily consuming the services not because of its direct benefits, but because they wish to satisfy other needs. Transport demand is about the movement of people and goods to satisfy other needs such as work, education, recreation etc., as well as transporting goods and services as part of the overall economic activities. Derived demand is related solely to the demand placed on consumption of a unit service for its ability to acquire or produce another good or service. Therefore, derived demand can be spurred by what is required to complete the production of a particular good, including the capital, land, labor, and necessary raw materials [12]. In these instances, the demand for raw material is directly tied to the demand for products that require the raw material for their production. The principles of derived demand work in both directions. If the demand for a product decreases, then the demand for the goods required to produce that product will also decrease. Hence, in transport industry this can be illustrated with seasonal activities such as recreation activities which boom mostly during holidays, weekends and festive periods where more people demand transportation for recreational purposes.
One of the core concepts in transport and economics states that transportation is a derived demand, both for passengers and for freight transport alike. According to the author this assumption is reflected in the conventional literatures which underlines that transport exists because it is the expression of a spatially differentiated function of supply and demand, and is thus considered to be ‘derived’ from other activities [12]. However, he infers that the recent developments in logistics and supply- chain management underline a paradigm shift in the consideration of freight transport as a derived demand. He further noted that in many sectors of activity, the functions of production, consumption, and transportation have become embedded to the point that it is difficult to tell them apart. The author investigated the extent to which the concept of derived transport demand is being challenged by supply-chain management strategies and infers to overcome some of the inadequacies of the conventional perspective, it is suggested that several segments of freight-related activities should be considered as part of an integrated transport demand. Although operationally, derived demand still applies to freight distribution, strategically, at the level of global commodity chains, integrated demand appears to be the emerging paradigm that is worth investigating further [12].
The conventional perspective shown in many textbooks underlines, without activities taking place at an origin and destination transportation loses its purpose and thus cannot take place. Transportation is consequently an activity which is dependent on other activities; an auxiliary function much like a service. Fairly unnoticed from the economic and transport community, there has been a growing body of evidence that questions this core concept [13]. Since the origin of transportation as a field of scientific inquiry, the tenet that ‘travel is a derived demand’ has been accepted with little question, this view pervades modern transportation planning approaches Although this statement was made for the transportation of passengers, we argue that the issue of freight has even more profound implications for the concept of derived demand, of its relevance and applicability [14]. Understanding transport demand and to what extent is it a derived demand remains an issue to be investigated [15]. It has been argued that contemporary developments in freight distribution underline a new dynamic environment, often global in scale, which challenges the conceptualization of transportation as a derived demand [16]. Logistics is thus more than a functional change in freight distribution, since the paradigm it provides changes the structure of distribution itself. Before going further with this reconsideration, it is worth providing a basic review of what derived transport demand implies.
As transportation cannot exist on its own and cannot be stored, many economic activities involve a derived transportation demand, which comes in two categories: first, direct derived demand-considers movements that are directly the outcome of economic activities, without which they would not take place. For instance, work-related activities commonly involve commuting between the place of residence and the workplace as there is a supply of labor in one location (residence) and a demand of labor in another (workplace). For freight transportation, all the components of a supply chain require movements of raw materials, parts and finished products on modes such as trucks, rail or containerships. Second indirect derived demand-considers movements created by the requirements of other movements. The most obvious example is energy where consumption from transportation activities must be supplied by an energy production system requiring movements from zones of extraction to places of consumption. Warehousing can also be labeled as an indirect derived demand since it is a “non movement” of a freight element. Warehousing exists because it is virtually impossible to move commodities instantly from where they are produced to where they are consumed. Transportation can also be perceived as an induced (or latent) demand which represents a demand response to a reduction in the price of a commodity [17]. This is particularly the case in the context where the addition of transport infrastructures results in traffic increases due to higher levels of accessibility. Roadway congestion is partially the outcome of induced transport demand as additional road capacity results in mode shifts, route shifts, redistribution of trips, generation of new trips, and land use changes that create new trips as well as longer trips [18]. However, the induced demand process does not always take place. For instance, additional terminal capacity does not necessarily guarantee additional traffic as freight forwarders are free to select terminals they transit their traffic through, such as it is the case for maritime shipping [19].
Transport and economy
The evaluation of freight transport demand follows a long tradition that links the demand with numerous factors related to the economy, the firms and the respective modes concerned [20]. One of the most significant determinants in freight demand is variations in the GDP (Gross Domestic Product) as the more active an economy is, the more freight in circulation due to manufacturing and consumers demands. The nature of the economy, such as the respective share of the primary, secondary and tertiary sectors, contributes to the level of freight intensity [21]. Despite of the concept stating the dematerialization of the economy, the quantity of freight being transported has steadily increased, making transport function central and very necessary for economic growth and development. Economic growth is related to increase in the production of economic goods and services over a period of time, which can be measured in real gross domestic product (GDP). GDP can be expressed in two different ways—nominal GDP and real GDP. Nominal GDP takes current market prices into account without factoring in inflation or deflation. Nominal GDP looks at the natural movement of prices and tracks the gradual increase of an economy's value over time. To be most accurate, the measurement must remove the effects of inflation [22].
On the contrary, real GDP factors in inflation, meaning it accounts for the overall rise in price levels. Real GDP accounts for all goods and services produced by domesticated industries. It is the monetary value of all the finished goods and services produced within a country’s borders in a specific time period and include anything produced within its borders by the country's citizens and foreigners. It is primarily used to assess the health of a country's economy. The GDP of a country is calculated by adding the following figures together: personal consumption; private investment; government spending; and exports (less imports). Economists generally prefer using real GDP as a way to compare a country's economic growth rate. Real GDP is how economists can tell whether there is any real growth between one year and the next [22].
Economic growth creates more profit for businesses as more productions are made with increase in distribution and consumers’ willingness to pay for the consumption of additional products and services. Infers that Gross Domestic Product (GDP) is the best way to measure economic growth, because it accounts for increase in production of goods and services which are supplied and consumed by the population. It takes into account the country’s entire economic output. It includes all goods and services that businesses in the country produce for sale. GDP measures final production and does not include parts that are manufactured to make a product (semi- finished product). Purchases drive higher economic growth, effective distribution of finished products and service enables availability, increasing purchase and hence, higher economic growth and subsequently economic development. Economic growth deals with increase in the level of output, while economic development is related to increase in output coupled with improvement in the social and political welfare of people within a country, which transportation plays a major role in achieving economic growth and development through efficient distribution of economic goods and services. On the other hand, GDP per capita (also called GDP per person) is used as a measure of a country’s standard of living. GDP per capita is gross domestic product divided by year population [22].
This accounts for real GDP distributed over a population. Per capita is a measure of efficient cargo distribution in a country. This entails the rate and degree of circulation of consumer goods and purchasing power of citizens of a nation. A country with a higher level of GDP per capita is considered to be better off in economic terms than a country with a lower level. GDP per capita is derived by first converting GDP in national currency to U.S. dollars and then dividing it by total population. Hence, GDP per capita is expression in current U.S. dollars per person or income of the population.
Economic growth and development is a two-way relationship. According to the authors, the first chain consists of economic growth benefiting human development, since economic growth is likely leading to increase production and consumption which in turn furthers human development through increase distribution, consumption and infrastructural development [23].
The development of a country has been associated with different concepts but generally encompasses economic growth through higher productivity, with this in mind, infer that economic development is typically associated with improvements in a variety of areas or indicators (such as literacy rates, life expectancy, and poverty rates), that may be causes of economic development rather than consequences of specific economic development programs which are political in nature. Many a times the economic development goals of some countries cannot be reached because they neglect or lack the core capabilities to do so [24-25]. For example, if a nation has little capacity to carry out basic functions such as security but lack core service delivery via good transport infrastructure/system, it is most likely that programs that would foster a free-trade zone (special economic activities) or distribution of vital services to the populace cannot be accomplish to achieve goals. Logistics function has been something overlooked by multiple international organizations. Many governments only copyright or adopt forms of political programs that have been successful elsewhere but that only hide institutional dysfunction without solving problems and can contribute to getting the nation stuck in ‘capability traps’ where the country does not advance in its development goals [26-30]. One important understanding in economic development is the promotion of regional cluster and a thriving municipal economy. In today's global landscape, location is vitally important and becomes a key in competitive advantage. Transportation plays a major role in filling or bridging the gaps created in regions between demand and supply needs, ensuring effective distribution and movement of labor, raw materials, and finished goods and service to final consumers.
In this, the researchers used real GDP to determine the amount of cargo produced in Nigeria and GDP per capita as the amount of cargo distributed in Nigeria. The research covers the periods 2001-2017. The data utilized in this study were sourced from secondary sources and expert opinions were consulted for a guide to our inference on this study. The secondary sources comprise of online periodic published reports on real Gross Domestic Products (GDP) and GDP per capita for the periods 2001- 2017. All extracted data focuses on the key elements, ensuring that only essential information is presented.
This study adopts quantitative and qualitative methods of analysis. It is also inductive in style as the analysis is drawn largely from already established data sources balanced by judgmental opinions of the experts. The secondary data provides necessary input for a multi-criteria decision model that would be developed in this study. The models will without any form of bias analyze, evaluate to answer the research questions and will be useful to suggest viable ways to enhance cargo distribution in Nigerian economy as to improve economic growth and development.
Univar ate statistics of standard deviation and bivariate statistics of regression analysis were relevant tools employed for data analysis using SPSS version 22 software. Standard deviation is a measure of the amount of variation or dispersion of a set of values. A low standard deviation indicates that the values tend to be close to the mean of dataset, therefore, there is no significant increase/growth on data variables for the periods 2001- 2017: while a high standard deviation indicates that the values are spread out over a wider range, hence, there is significant increase/growthon gross data variables for the periods 2001-2017. Standard deviation measures the dispersion in a dataset relative to its mean and is calculated as the square roots of variance by determining each data point deviation relative to the mean. If the data points are farther from the mean, there is a higher deviation (growth) within the data set; thus the more spread out the data, the higher the standard deviation. Hence, a higher deviation would be regarded as a significant increase in GDP and GPD per capital respectively.
Where, s= sample standard deviation Σ=Sum of... ¯x =sample mean n =number of scores in sample
Furthermore, the researchers used regression analysis to determine the relationship between dependent variable (GDP) and independent variable (GDP per capita) for Nigerian economy.
Regression equation is given as y=a+bx. Where, y is the dependent variable (GDP) x is the independent variable (GDP per capita) b is the slope of the line a is the intercept (y when x=0) Hence, the formula for regression line is stated as 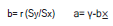
Linear and growth lines of the data below. From the geometrical graph there is a downward curve showing a decline on growth line of the observed data for the periods 2001-2017. The downward curved on the growth line represents drops in production of goods and services or decreasing GDP which is an indication of diminution on economic growth as well as development. This depicts unstable economic activities which may be as a result of inadequate production of goods and services in the Nigerian economy (Figures 1 and 2).

Figure 1. Geometrical presentation of GDP 2001-2017.
The descriptive statistics table below, the standard deviation is given as $87,461.85157 while the arithmetic mean is $275,902.8594. The lower the dispersion or variability, the lesser the standard deviation and lesser will be the magnitude of the deviation of the value from the mean. On the other hand the higher the dispersion or varisability, the greater is the standard deviation and greater will be the magnitude of the deviation of the value from the mean. This shows that in the normal distribution curve, the standard deviation is closer to the mean or lesser showing decreasing GDP which implies diminution in production of goods and services; this have a negative impact on economic growth and development (Table 1).

Figure 2. Linear growth curve of GDP for the periods 2001-2017.
| Descriptive statistics | ||||||||||
|---|---|---|---|---|---|---|---|---|---|---|
| N | Minimum | Maximum | Sum | Mean | Std. Deviation | Variance | Skewness | |||
| Statistic | Statistic | Statistic | Statistic | Statistic | Std. Error | Statistic | Statistic | Statistic | Std. Error | |
| GDP$ | 17 | $79,457.02 | $387,844.92 | $4,690,348.61 | $275,902.8594 | $21,212.61484 | $87,461.85157 | 7.6E+09 | -0.53 | 0.55 |
| Valid N (listwise) | 17 | |||||||||
Linear inverse and growth lines of the data below. From the graph we can observe the inverse line which curves upward, signifying dispersion on the data (GDP per capita) for the periods 2001-2017. Many data points on the graph fell away from the linear line showing that the data points have outliers which are divergent from the linear line signifying effective distribution of goods and services to the growing population of Nigeria. This suggests that if more goods and services are produced and distributed, there will be more spreading of GDP per capita in Nigerian economy, which signifies increasing standard of living of the people (Figures 3 and 4).

Figure 3. Geometrical presentation of GDP per capita 2001-2017.

Figure 4. Linear growth curve of GDP per capita for the periods 2001-2017.
The table below the standard deviation is calculated as $99,529.80371 while the arithmetic mean is given as $54,122.8176. The higher the dispersion or variability, the greater is the standard deviation and greater will be the magnitude of the deviation of the value from the mean. This shows that in the normal distribution curve, the standard deviation is far from the mean or greater showing effective distribution of goods and services to Nigeria population. This implies that growth or increase in production of goods and services (GDP) will have positive impact on cargo distribution (GDP per capita) in the Nigerian economy (Table 2).
| Descriptive statistics | ||||||||||
|---|---|---|---|---|---|---|---|---|---|---|
| N | Minimum | Maximum | Sum | Mean | Std. Deviation | Variance | Skewness | |||
| Statistic | Statistic | Statistic | Statistic | Statistic | Std. Error | Statistic | Statistic | Statistic | Std. Error | |
| GDP_per_capital | 7 | $590.00 | $291,556.14 | $920,087.90 | $54,122.8176 | $24,139.52315 | $99,529.80371 | 9.906E+09 | .562 | 0.55 |
| Valid N (list wise) | 7 | |||||||||
From the table gives the R value=0.272 meaning that the correlation coefficient of real values and predicted values correlate at the level 0.272. Also, the r-square value of 0.74 implies that the independent variable explains 74% all of the variance of the dependent variable (Table 3).
| Model summary | |||||
|---|---|---|---|---|---|
| Model | R | R Square | Adjusted R Square | Std. Error of the estimate | |
| 1 | .272a | 0.074 | 0.012 | 86917.23376 | |
|
|||||
The f-value is 1.201, and the corresponding significance level is 0.290, hence, the independent variable influences the dependent variable (Table 4).
| ANOVAa | ||||||
|---|---|---|---|---|---|---|
| Model | Sum of squares | Df | Mean square | F | Sig. | |
| 1 | Regression | 9074124821 | 1 | 9074124821 | 1.201 | .290b |
| 1.13319E+11 | 15 | 7554605524 | ||||
| 1.22393E+11 | 16 | |||||
| a. Dependent variable: GDP | ||||||
| b. Predictors: (constant), GDP_Per_Capita | ||||||
From the regression coefficients table, the value 28852.855 is the constant which is the predicted amount of GDP (goods and services produced) when GDP per capita is 0. This analysis shows a negative slope (-0.239) indicating an abnormality in the behavior of the economy. Hence, to correct this abnormality the absolute value of the slope should be considered then, the regression equation becomes y=28852.855+0.239 x, which implies that a unit increase in the independent variable (GDP per capita) will increase the dependent variable (GDP). This can then be used to determine the GDP by setting a benchmark for GDP per capita with regards to increasing population. This will help to determine the amount of goods and services required to bring about the needed growth and development in the Nigerian economy (Table 5).
| Coefficientsa | ||||||
|---|---|---|---|---|---|---|
| Model | Unstandardized coefficients | Standardized coefficients | T | Sig. | ||
| B | Std. Error | Beta | ||||
| 1 | (Constant) | 288852.855 | 24166.2 | 11.953 | 0 | |
| GDP_Per_Capita | -0.239 | 0.218 | -0.272 | -1.096 | 0.29 | |
| a. Dependent Variable: GDP | ||||||
The results of the study explicitly show that there is no significant increase/growth on gross domestic product between the periods 2001-2017 in the Nigerian economy. The result further shows a decline or unstable economy represented by the steep curve on the growth line. Secondly, there is effective distribution of goods and services. The GDP per capita accounts for the real GDP and increasing population between the periods 2001-2017. The regression analysis provides a model for the relationship between dependent and independent variables to determine the GDP required to effect economic growth and development in the Nigerian economy.
In summary, this explains that the Nigeria economy is facing serious economic downturn, which may need urgent attention. The study identifies heavy economic recession, low production of goods and services and low capita income affected by increasing population. The standard deviation of Nigeria GDP is below the arithmetic mean which implies that enough goods and services are not produced to spread out over the increasing population. An average Nigerian can be said to be poor or living below poverty level. This type of economy is obdurately characterized by high rate of unemployment, low production of goods and services, low purchasing power, youth restiveness, criminality, and high dependency rate.
The regression equation given in this study can provide a basis for the government to set a benchmark to determine the required GDP (annually or quarterly) to foster economic growth in Nigeria. Government should open up economic sectors, encourage public and private investments, create enabling environment for businesses to thrive, and promote job creation for the teeming youths.