Research Article - (2024) Volume 13, Issue 3
Received: 17-May-2024, Manuscript No. idse-24-136316;
Editor assigned: 20-May-2024, Pre QC No. P-136316;
Reviewed: 03-Jun-2024, QC No. Q-136316;
Revised: 10-Jun-2024, Manuscript No. R-136316;
Published:
17-Jun-2024
, DOI: 10.37421/2168-9768.2024.13.428
Citation: Workneh, Aschalew Cherie, K.S. Hari Prasad and
C.S.P. Ojha. “Irrigation Scheduling using Crop Water Stress Index for Wheat
Crop.” Irrigat Drainage Sys Eng 13 (2024): 428.
Copyright: © 2024 Workneh AC, et al. This is an open-access article distributed under the terms of the Creative Commons Attribution License, which permits unrestricted use, distribution, and reproduction in any medium, provided the original author and source are credited.
The study aimed to assess the viability of utilizing canopy temperature-based Crop Water Stress Index (CWSI) for irrigation scheduling in wheat crop (Triticum Aestivum L.). Field experiments were carried out for the 2021-2022 and 2022-2023 cropping periods at the irrigation laboratory of the Civil Engineering Department at the Indian Institute of Technology Roorkee, Roorkee, India. The experimental field was divided into six plots, each subjected to different irrigation treatments based on the depletion of Total Available Soil Water (TASW) within the crop's root zone. These irrigation treatments maintained varying levels of Water Depletion in the Soil (WDS) of TASW, encompassing 10%, 25%, 35% and 50%, as well as fully irrigated (non-stressed) and extremely dry (fully stressed) conditions. Multiple regression analyses between meteorological and crop parameters were conducted to establish a baseline. The CWSI was subsequently calculated for various levels of WDS of TASW using an empirical method. It was found that the irrigation treatment corresponding to 50% WDS, with a mean CWSI of 0.36, resulted in optimal yield and maximum water use efficiency. The findings of the study suggest that the established CWSI value can effectively identify stress levels and serve as a valuable tool for scheduling irrigation in wheat crop.
Crop water stress index • Irrigation scheduling • Water productivity • Wheat • Crop yield
The ever-increasing population, rapid economic development and climate change are some of the factors increasing the strain on water sources. These challenges can only be mitigated through effective utilization of all available resources in an efficient and sustainable manner. The agricultural sector accounts for about 80% of the withdrawn freshwater by humans. The major constraint for agricultural production in India is water shortage. The relation between crop yield and water use has been a focus area for agricultural research, particularly in arid and semi-arid regions. Unsustainable and poor water management practices have caused a decline in global per capita water availability and resulted in increased water scarcity. Increasing water scarcity calls for immediate actions for innovative solutions that lead to sustainable and integrated water management. Most irrigation projects in India currently operate at significantly low-efficiency levels [1]. There is a pressing need to implement advanced water management technologies to address this issue and meet the growing demand for water resources. Agronomists need to know the irrigation schedule of the crop (the amount of water to be provided and when to provide it). Irrigation scheduling significantly affects yield and yield components of wheat crop. In a study conducted by Belder P, et al. [2] and Zhang H and Oweis T [3], it was noted that the irrigation schedule significantly affects wheat crop's yield and yield components. The findings revealed that frequent irrigation led to a significant decrease in yield. These observations underscore the importance of implementing efficient and optimal irrigation schedules. The recommendation is to apply water in the field only when crops require it the most, as highlighted by previous studies [4,5]. A comprehensive understanding of soil-crop-weather interactions is crucial for effective irrigation scheduling, as Shankar V, et al. emphasized [6]. Early detection of crop water stress emerges as a key factor in ensuring timely and appropriate irrigation practices. Generally, the passage emphasizes the need for tailored irrigation management for Indian mustard crops, considering the intricate relationships between soil, crop and weather conditions. Efficient irrigation schedules should be informed by a nuanced understanding of these interactions and the prompt identification of water stress in crops.
Estimating soil moisture levels and crop evapotranspiration based on climatic parameters offers an objective framework for efficient irrigation management [7,8]. However, conventional methods for estimating evapotranspiration necessitate extensive climatic data, which are rarely accessible and often overlooked by typical crop growers. Estimating crop water requirements by relying solely on soil moisture necessitates measurements at multiple locations, a time-consuming process that may not accurately assess the crop's water needs. Conversely, the plant-based indicator approach involves evaluating the plant's water status to schedule irrigation. This approach can be regarded as an ideal criterion, as it reflects a holistic integration of soil conditions, water availability and climatic factors within the plant.
Determination of crop water stress is receiving significant attention these days, especially in arid and semi-arid countries, for quantifying water stress and effective irrigation scheduling. In many arid and semi-arid environments, water scarcity drastically limits sustainable agriculture. Precision irrigation is a promising method for conserving water and promoting agricultural sustainability [9,10].
The Crop Water Stress Index (CWSI) received widespread acceptance as a reliable, cost-effective and non-destructive approach and a good indicator of agricultural water status [7,11-13]. It is a tool that can detect the onset of water stress. CWSI ideally ranges from 0 to 1, with 0 denoting a well-watered and 1 denoting a water-stressed situation. The main problem in CWSI estimation is determining baseline canopy temperatures. Numerous empirical studies [14-16] have suggested the existence of distinct non-water-stressed baselines for various crops, necessitating their determination within each agroclimatic zone. Kumar N, et al. [17] investigated the crop water stress index for Indian mustard at different growth stages under deficit irrigation scheduling. Meanwhile, Cherie Workneh A, et al. [18] conducted an experimental study on paddy crop to formulate baseline canopy temperatures for irrigation scheduling. These baseline canopy temperatures can be employed to quantify CWSI, facilitating the assessment of crop water stress in paddy crop. Furthermore, these baseline canopy temperatures are valuable for irrigation scheduling and yield prediction.
The main objective of this study was to utilize the crop water stress index as a tool for irrigation scheduling in wheat cultivation at the Irrigation Laboratory of the Department of Civil Engineering, Indian Institute of Technology Roorkee, India. The specific goals of this research were as follows:
To establish baseline canopy temperatures and calculate the crop water stress index for wheat crops subjected to different levels of irrigation water application.
To formulate an effective irrigation schedule for wheat cultivation, considering crop yield, irrigation amount and water use efficiency.
Experimental program
The experiments were carried out at the irrigation field laboratory at the Civil Engineering Department, Indian Institute of Technology Roorkee, India, located at an altitude of 274 meters above mean sea level (latitude 29°52'00" N, longitude 77°53'52" E). The study area experiences a hot and humid summer and a cold and dry winter. The region receives an annual rainfall of 1050 mm, with 80% of the precipitation occurring during the monsoon season. The mean minimum temperature ranges from 7.2 °C in January to 25.6 °C in July, while the maximum temperature ranges from 19.33 °C in January to 37.73 °C in May. The average relative humidity varies from 52.2% in May to 89.7% in January.
In this experiment, six plots were prepared during the 2021-2022 (season1) and 2022-2023 (season 2) cropping seasons (Figure 1). Two lysimeters with a square shape and an area of 1 m2 with a depth of 1.5 m repacked soil were installed to measure deep percolation. The lysimeters are constructed from steel metal sheets. The repack soil in the lysimeters consists of the top 1.3 m sandy loam soil underlain by 0.12 m tick gravel (approximately 2 cm in diameter) and the bottom 0.08 m very coarse gravel (size more than 3 cm in diameter). This arrangement allows drainage towards the buckets. The experiment involved growing wheat (T. Aestivum L.) from November to April. The experimental layout and the size of each plot can be seen in Figure 1, where all dimensions are given in meters. Prior to sowing the seed, each plot was saturated completely. The first cropping season involved seed sowing on November 29, 2021 and harvesting on April 16, 2022. For the second cropping season, the sowing was done on November 22, 2022 and the harvest was on April 08, 2023. Irrigation was provided at six levels of water treatments based on the Water Depletion level in the Soil (WDS) with reference to the Total Available Soil Water in the crop root zone (TASW). Treatment T1 was well-watered to keep the soil moisture close to field capacity, whereas T6 was irrigated only for crop survival during the entire crop-growing period. The maximum level of soil water depletion allowed in irrigation treatments T2, T3, T4 and T5 was 10%, 25%, 35%, 50% of ASW, respectively.

Figure 1. The layout of irrigation treatments: T1 (well-watered); T2 (10% of WDS); T3 (25% of WDS); T4 (35% of WDS); T5 (50% of WDS); and T6 (dry).
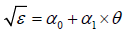
The amount of water available in the crop root zone was determined using the soil moisture content (θ), which is measured as the ratio of the volume of water in the soil to the volume of soil. The moisture content of soil can be measured using a variety of techniques. However, this work used a soil water profile probe (PR2/6; Delta T Devices, Cambridge, United Kingdom) to measure the soil moisture content inserted via access tubes that were put within each irrigation plot. The profile probe sensor, attached to a specific HH2 moisture meter, measures the soil depths at 100, 200, 300, 400, 600 and 1000 mm from a reference point. The probe is made up of a sealed polycarbonate rod with an approximate diameter of 25 mm and electronic sensors spaced out along its length. Each sensor contains a 100 MHz oscillator and transmits an electromagnetic field that penetrates the soil around 100 mm. Its permittivity, √ℇ, is mainly determined by the soil's moisture level surrounding the rings. A connection between soil permittivity and soil moisture content [19] can be established as follows:
 (1)
(1)
Where ε represents the dielectric constant of soil, αo and α1 represent calibration constants and θ represents the soil moisture content. The constants, which depend on the kind of soil, allow us to translate probe readings into estimates of soil moisture content. For example, the soil moisture variation for six irrigation treatments at 0.1 m depth for season 1 (2021-2022) is presented in Figure 2.

Figure 2. Soil moisture variation during crop growth period (Season 1) for different irrigation treatments.
The irrigation water amount for each plot was determined based on the percentage depletion in the crop root zone, which was calculated using the Equation WDS = (F.C. - VWC)/TASW.
Soil physical properties
Soil physical properties were analyzed by collecting soil samples from three locations (viz. 0-25 cm, 25-50 cm and 50-75 cm) at varying depths in the plots. Laboratory experiments were conducted on the collected samples to determine their physical properties. The bulk density of the soil was determined using the core cutter method while the soil particle density was determined using the water pycnometer test. The size of the soil particles was classified according to the American Society for Testing and Materials (ASTM) procedures. The soil particle size distribution for the collected samples is shown in Figure 3.

Figure 3. Particle size distribution of collected samples from three spots. a) 0-25 cm; b) 25-50 cm; c) 50-75 cm depth from ground surface.
The study utilized air-dried soil samples that had passed through a 2 mm sieve. Three soil samples were subjected to eight different pressure levels of 0.33, 0.75, 1, 2.5, 5, 7.5, 10 and 15 bars. Prior to the pressure treatment, ceramic pressure plates were saturated for 24 hours with appropriate pressure limitations. The soil samples were placed in rubber retainer rings (5 cm in diameter and 1 cm in height) on the saturated ceramic pressure plate in three repetitions. Water was added until the samples were completely saturated and then the pressure vessel was sealed with a cover and bolts. An air compressor was connected to the pressure plate apparatus through a PVC tube to regulate the pressure and the device was run until the water content in the soil samples reached an equilibrium state. This process was repeated for 27 combinations of pressure treatments, with three replicates for each soil sample pressure vessel. The physical properties of the soil for the experimental study are presented in Table 1.
| Depth below Ground Level (cm) | Bulk Density (g/cm3) | Particle Density (g/cm3) |
Clay (%) | Silt (%) | Sand (%) | θfc (%) | θpwp (%) |
|---|---|---|---|---|---|---|---|
| 0-25 | 1.72 | 2.82 | 5.5 | 21.6 | 72.9 | 28.54 | 6.5 |
| 0-25 | 1.43 | 2.46 | 6.3 | 27.5 | 66.2 | 28.16 | 5.1 |
| 50-75 | 1.54 | 2.56 | 5 | 27 | 68 | 27.15 | 7.5 |
Crop parameters
Tilling and strenuous activities were used for field preparation. Two weeks prior to sowing, green manure was applied to all treatment plots. After sowing, zinc sulfate and Di-Ammonium Phosphate (DAP) fertilizers were applied, followed by urea three weeks later, in accordance with local agronomic regulations. Manual weed control was involved to remove the weed from the field two to three times. The crop was additionally protected from harmful insects using insecticides that were commonly used in the region.
Weekly measurements of crop parameters, including Leaf Area Index (LAI), crop height (h) and root depth, were conducted throughout the experiment. The AccuPAR Ceptometer LP-80, manufactured by Decagon Devices Inc. in Pullman, USA, was used to measure LAI. Root depth was measured using the trench profile method, with a trench width of 0.6 m and variable depths depending on the crop growth stage. Crop height was measured every 7-8 days using a tape meter. The LAI, crop height and root depth of wheat at various irrigation water treatment levels were presented in Figures 4-6 for the duration of the experiment.

Figure 4. Observed LAI during the experimental periods. a) Season 1; b) Season 2.

Figure 5. Measured crop height throughout the crop seasons.

Figure 6. Measured root depth throughout the crop seasons. a) Season 1; b) Season 2.
Canopy temperature and meteorological variables
A portable, handheld, non-contact infrared thermometer (DT-8550 with a measuring precision of 2 °C, spectral response 5-14 um, a response time of 0.8 seconds and resolution of 0.1 °C) was used to determine the canopy temperature (Tc). The canopy temperature was measured daily between 1 and 2 pm on clear sky days. Tc was measured from four directions (East, West, North and South) to counteract the radiation effect. The average value of Tc was used for the determination of the crop water stress index. Tc measurement began 20 days after sowing (DAS) when crops covered 70% o of the ground. Figure 7 shows the canopy temperature for each irrigation treatment for the study period.

Figure 7. Canopy temperature for each irrigation treatment during a) Season 1; b) Season 2.
Weather data, including Air Temperature (Ta), Relative Humidity (R.H.) and wind speed (u), were obtained from the National Institute of Hydrology (NIH) meteorological station for the crop growth period. The climatic variables used for this study are shown in Figure 8. Table 2 provides a comprehensive overview of the irrigation events to various plots throughout the cropping season during the entire study period. In addition, it highlights the total rainfall recorded for wheat crop in the years 2021-2022 and 2022-2023, which amounted to 196 mm and 94 mm, respectively.
| Season | Treatment | Water Depletion in Soil | Irrigation (mm) | Rainfall (mm) |
|---|---|---|---|---|
| Season 1 | T1 | 0 | 109 | 196 |
| T2 | 10 | 74 | - | |
| T3 | 25 | 64 | - | |
| T4 | 30 | 94 | - | |
| T5 | 50 | 4 | - | |
| T6 | Dry | 0 | - | |
| Season 2 | T1 | 0 | 104 | 94 |
| T2 | 10 | 189 | - | |
| T3 | 25 | 171 | - | |
| T4 | 30 | 186 | - | |
| T5 | 50 | 111 | - | |
| T6 | Dry | 62 | - |

Figure 8. Meteorological data used for this study. a) Air temperature; b) Relative humidity; c) Wind speed.
Crop Water Stress Index (CWSI)
The Crop Water Stress Index (CWSI) is essential for scheduling irrigation, detecting water stress in crops and predicting crop yield [7,12,13]. It's important to note that CWSI is just one of many tools that can be used to monitor crop water stress and it should be used in conjunction with other indicators such as soil moisture levels and plant growth characteristics. CWSI calculations can be affected by factors such as atmospheric conditions and crop canopy structure, so using the index in the context of the specific crop and growing conditions is important.
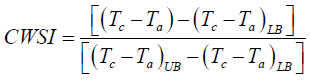
In this study, the empirical approach was used since it is simple and provides reliable CWSI. Previous studies used a linear regression between (Tc-Ta) and AVPD to establish the upper and lower baseline temperatures for CWSI. However, this study used multiple regression analysis to estimate the baseline temperatures using (Tc-Ta) and meteorological and crop factors. Empirical CWSI estimation was first proposed by Jackson RD, et al. [14], is defined as:
 (2)
(2)
Where Ta is air temperature (°C), Tc is canopy temperature (°C), (Tc-Ta) L.B (°C) is the minimum stress at lower baseline temperature and (Tc-Ta) U.B (°C) is the maximum stress at upper baseline temperature. A CWSI value of 1 indicates severe water stress, while a value of 0 indicates no water stress.
Upper and lower CWSI baselines
Multiple regression analysis was used to compute the upper and lower CWSI baselines, taking into consideration variables such as crop height (h), wind speed (u), the difference between canopy and air temperatures (Tc-Ta) and AVPD, which had a significant impact on baseline temperature.
The limits for upper and lower baselines from earlier studies for the same crop showed significant differences [20,21]. This could be because many researchers focused solely on AVPD and neglected other factors like crop height and wind speed, which substantially impact baseline computations.
The lower CWSI baseline for rice is a function of crop height (h), AVPD and wind speed (u). In contrast, the upper CWSI baseline is a function of crop height (h) and wind speed (u) but was not dependent on AVPD. The developed baseline equations for wheat crop in terms of these variables are as in Eqns. (3) and (4).
 (3)
(3)
 (4)
(4)
The developed equations were used to calculate the empirical CWSI of wheat for different treatments (Eqn.2).
CWSI for wheat crop
A multiple regression analysis was conducted to estimate baseline canopy temperatures based on relevant weather and crop parameters. These baseline canopy temperatures served as the foundation for calculating the CWSI under various irrigation treatments. Throughout the study's crop season, Eqn. 2 was utilized to compute the CWSI for the wheat crop and the results are illustrated in Figure 9. It is important to note that the Canopy Temperature readings (TC) commenced on the 20th DAS when the crop had covered 80% of the soil. Consequently, CWSI values preceding this date are not depicted in Figure 9. CWSI values approaching 0 indicate no stress conditions, whereas values approaching 1 signify maximum stress conditions. These observations were recorded up to the 98th DAS.

Figure 9. Variation of crop water stress index across different treatments. a) Season 1; b) Season 2.
In the case of T1 and T2, the CWSI values exhibited remarkable similarity. The CWSI values for T1 ranged from 0 to 0.51 and a mean value of 0.18. A CWSI of zero suggests that the crop was not undergoing any moisture stress and was transpiring at its potential rate.
Conversely, for T3, the CWSI exhibited a wider range, fluctuating between 0.01 and 0.56, with an average CWSI of 0.24. Throughout most of the crop season, the CWSI remained below 0.3. However, it demonstrated a gradual increase during crop maturity when irrigation ceased. Notably, during crop development and mid-season stages, the CWSI experienced rapid spikes, primarily attributed to substantial root moisture uptake, leading to supplemental irrigation to replenish the depleted soil moisture. Figure 9 illustrates frequent peaks in CWSI values during these instances.
In the case of treatment T5, the CWSI predominantly exceeded 0.4 throughout most of the crop season, peaking at a maximum of 0.79 towards the end of the season. The average CWSI value for treatment T5 was calculated to be 0.4.
In the case of T6, irrigation was provided only one irrigation event prior to sowing and three irrigation events for crop survival around the development stage. Moisture stress increased for all treatments because the irrigation water supply was discontinued, coinciding with the crop entering the post-maturity and harvesting stage after 89 DAS. However, the presence of rainfall during the season played a crucial role in alleviating moisture stress and supporting crop growth.
Water application
The water application, yield and water use efficiency of the wheat crop obtained from the six treatments for seasons 1 and 2 are shown in Table 3. The relationship between the amount of water applied (through irrigation or rainfall) to wheat crop in various treatments, as detailed in Table 3 and the mean CWSI was examined. A linear analysis was conducted to assess the correlation between the depth of irrigation water applied and the mean CWSI, resulting in an R2 value of 0.81 (Figure 10). This relationship, denoted by Eqn.5, exhibits a negative slope, indicating a reduction in water application as the CWSI increases. The linear relationship obtained is expressed as follows:
 (5)
(5)
| Parameters | Treatments | ||||||
|---|---|---|---|---|---|---|---|
| Season | T1 | T2 | T3 | T4 | T5 | T6 | |
| Irrigation and rainfall (mm) | Season 1 | 305 | 270 | 260 | 290 | 200 | 196 |
| Season 2 | 300 | 283 | 265 | 280 | 205 | 156 | |
| Yield (kg/ha) | Season 1 | 1675 | 1537.5 | 1630 | 1650 | 1300 | 900 |
| Season 2 | 1693 | 1550 | 1650 | 1620 | 1279 | 790 | |
| WUE (kg/ha/mm) | Season 1 | 5.49 | 5.69 | 6.3 | 5.69 | 6.5 | 4.59 |
| Season 2 | 5.64 | 5.48 | 6.2 | 5.79 | 6.24 | 5.06 | |
| Mean CWSI | Season 1 | 0.07 | 0.2 | 0.24 | 0.31 | 0.36 | 0.5 |
| Season 2 | 0.09 | 0.2 | 0.25 | 0.34 | 0.45 | 0.53 | |

Figure 10. Water applied (mm) for various treatments as a liner function of mean CWSI.
Yield
Crop yields for the various treatments were calculated by harvesting the wheat crop from each (4 m2) area and then converting the results to per-hectare yield. The wheat crop yield data is depicted in Figure 11. The highest yield was achieved in T1, with a production of 1684 Kg/ha, whereas the lowest yield was recorded in T6, with a production of 1200 Kg/ha. Notably, the yield in T6, which did not receive supplemental irrigation, was significantly lower than in T1 by 28.7%. This substantial yield disparity can be attributed to persistent moisture stress in T6 throughout the entire cropping season. Under moisture stress conditions, plants experience a loss of turgidity and reduced assimilate translocation, ultimately leading to a diminished yield output.

Figure 11. Wheat yield (kg/ha) across different irrigation treatments.
The yield of T1 closely approximated that of T3, differing by just 3.8%, which can likely be attributed to the frequent irrigation applied in T1. This outcome underscores the idea that maintaining soil moisture content at field capacity doesn't necessarily guarantee maximum yield.
To develop the relationship between yield and the mean CWSI, a non-linear polynomial function was employed, yielding a correlation coefficient of R2 value of 0.85 (Figure 11). This Equation, represented as Eqn.6, demonstrates a negative slope, indicating that as the CWSI increases, there is a corresponding reduction in crop yield. The non-linear polynomial function can be expressed as follows:
 (6)
(6)
Water use efficiency
Water Use Efficiency (WUE) is a crucial metric defined as the ratio of yield obtained to the water (from either irrigation or rainfall) applied [22]. It is a vital tool for optimizing crop irrigation schedules and the same principle was applied in this study for wheat cultivation. For instance, in season 2, T1 yielded 1693 kg/ha with 300 mm of applied water, while with 280 mm of applied water, it produced 1620 kg/ha. Notably, the highest WUE values were achieved in T5, reaching 6.50 and 6.24 during season 1 and season 2, respectively, whereas T6 exhibited the lowest WUE. Based on these findings, it is evident that T5 represents the most effective irrigation treatment for wheat crops, which agrees with the findings of Gontia NK and Tiwari KN [1].
In Figure 12, the relationship between WUE and the mean CWSI for various irrigation treatments of wheat is illustrated, yielding R2 value of 0.66. This graph reveals that WUE follows a non-linear polynomial function concerning mean CWSI. WUE demonstrates an increasing trend with rising CWSI, reaching a peak before declining as CWSI values continue to increase. The non-linear relationship between WUE and CWSI can be expressed as follows:
 (7)
(7)

Figure 12. Water use efficiency (kg/ha/mm) for different treatments.
This study's findings highlight the use of infrared thermometry-based Crop Water Stress Index (CWSI) for assessing stress levels and efficiently scheduling irrigation for wheat crop. The key conclusions can be drawn from this research include:
The newly developed baseline canopy temperature derived from weather conditions and crop parameters proves to be a reliable method for estimating CWSI in the study area and regions with similar agro climates.
The irrigation schedule that led to higher crop yields and Water Use Efficiency (WUE) is deemed optimal. The variations in CWSI values for that specific treatment are recommended as the foundation for scheduling irrigation for wheat crops in the region.
An average CWSI value of 0.36 corresponds to 50% soil moisture depletion in treatment T5, indicating optimal water use efficiency. This implies that irrigation should be initiated when the CWSI surpasses 0.36 to minimize crop stress and maximize seed yield.
The relationships established through graphical regressions offer an effective tool for estimating seed yield, Water Use Efficiency (WUE) and water application as functions of CWSI.
In summary, this study underscores the feasibility of employing CWSI as a straightforward, non-destructive and reliable irrigation scheduling technique, thereby optimizing irrigation water resource utilization.
The corresponding author can furnish some or all the data in this study upon request.
None.
The authors declare that there is no conflict of interest.
Google Scholar, Crossref, Indexed at
Google Scholar, Crossref, Indexed at
Google Scholar, Crossref, Indexed at
Google Scholar, Crossref, Indexed at
Google Scholar, Crossref, Indexed at
Google Scholar, Crossref, Indexed at
Google Scholar, Crossref, Indexed at
Google Scholar, Crossref, Indexed at
Google Scholar, Crossref, Indexed at
Google Scholar, Crossref, Indexed at
Google Scholar, Crossref, Indexed at
Google Scholar, Crossref, Indexed at
Google Scholar, Crossref, Indexed at
Google Scholar, Crossref, Indexed at
Google Scholar, Crossref, Indexed at
Google Scholar, Crossref, Indexed at
Google Scholar, Crossref, Indexed at
Google Scholar, Crossref, Indexed at
Google Scholar, Crossref, Indexed at
Google Scholar, Crossref, Indexed at
Google Scholar, Crossref, Indexed at
Irrigation & Drainage Systems Engineering received 835 citations as per Google Scholar report


