Research - (2022) Volume 13, Issue 3
Received: 01-Mar-2022, Manuscript No. bej-22-59288;
Editor assigned: 03-Mar-2022, Pre QC No. P-59288;
Reviewed: 15-Mar-2022, QC No. Q-59288;
Revised: 20-Mar-2022, Manuscript No. R-59288;
Published:
25-Mar-2022
, DOI: 10.37421/21516219.2022.13.375
Citation: Mao, Hong, Krzysztof Ostaszewski, Jin Wang and
Zhongkai Wen. “Mortality Improvement and Risk Analysis in Chinese Annuity
Insurance with Stochastic Interest Rate and Stochastic Investment Return” Bus
Econ J 13 (2022): 375.
Copyright: © 2022 Mao H, et al. This is an open-access article distributed under the terms of the Creative Commons Attribution License, which permits unrestricted use, distribution, and reproduction in any medium, provided the original author and source are credited.
In this article, we use Vasicek model to describe the stochastic processes for the investment return and deposit interest rate. We take into account time-varying correlation between investment return and deposit interest on the net premium of annuity. We then propose a model for pricing investment-linked annuity and evaluate the risk of mortality improvement. We use historical data from China and illustrate our model with numerical analyses. These analyses show that the risk of mortality improvement of immediate annuity is greater than that of deferred annuity except for whole life annuity. We also find that the risk of mortality improvement increases with the increase of duration of insurance.
Mortality improvement • Immediate and deferred annuity • Investment-linked • variable annuity • Vasicek model
With advances in medical technologies and improvements of health care, the expected lifetime of population in almost all developed countries and some developing countries is increasing significantly [1]. Point out that longevity and aging of population causes far-reaching social and economic challenges to economic and social systems around the world. The increase in average lifespan is commonly termed mortality improvement. This term does not refer to mortality improving, but rather to changes in mortality resulting in social improvement in the form of longer lives. Mortality improvement creates risks to the life annuity business of life insurance companies and to social insurance pension systems (commonly termed social security).
In the last three decades, scholars have paid a lot of attention to mortality improvement. Study mortality improvement of the senior population, over 80 years old, of 27 countries in the past several decades. They find that the mortality of high age or even super aged population is still declining. Compare the patterns of mortality improvement of different time and age groups of 18 developed countries from 1950 to 2000. Estimate overall mortality improvement with data from individually underwritten ordinary life insurance and annuity products. Analyze historical rates of mortality improvement based on the general Canadian population data up to 2011 from the Human Mortality Database (HMD) and some additional data up to 2015 from the Canadian Old Age Security (OAS) Program plan. They identify underlying trend of improvement rates with standard actuarial techniques for graduating volatile quantities. Use Poisson model for deaths at each age and year [2-5], proposed by Brouhns N, et al. [6], to model mortality improvement rate, and use a standard bootstrapping approach to investigate the uncertainty in parameters of their model. They demonstrate their model with historical population data from U.S., England and Wale.
There is also a body of work on mortality improvements for China [7,8]. Propose a model in estimating mortality improvement and analyze the effect of mortality improvement on two different annuity products: equity-linked annuity1 and traditional annuity. Their results show that the relative payment risk resulting from mortality improvement for traditional annuity is smaller than that for equity-linked annuity, and larger duration of a product imposes greater relative payment risk for equity-linked annuity due to mortality improvement [9]. Measure the market price of increased longevity risk and analyze the effect of longevity risk on individual annuity products under dynamic mortality [10]. Study the mortality improvement from 1949 to 2010 in China and show that longevity of Chinese population has been improving consistently since 1949, although the rate of mortality improvement decreases with time.
Chinese annuity market doesn’t have well developed annuity products; the varieties of annuity insurance policies are relatively limited. However, China has a population of 1.4 billons, there is a great potential for annuity market. China faces serious ageing problem and insurance companies face longevity risks. Developing annuity products which satisfy customers’ needs, and at the same time avoid longevity risk is top priority for insurance companies. In this paper, we extend Mao H, et al. [8] to more general cases. Our main contributions are followings. First, we use stochastic interest rate instead of constant risk-free interest rate. In general, constant risk-free interest rate is used as discount rate. However, we have shown that the interest rate is a stochastic process. Second, we consider the impact of time-varying correlation between investment return and deposit interest on the net premium rate of annuity insurance. Vasicek model captures the mean reversion and provides flexibility to describe the dynamic structure of interest rate. We show that Vasicek stochastic model can well model both investment return rate and deposit interest rate, and fitting errors are quite small [11,12].
The remainder of this paper is organized as follows. Second section presents a model for mortality improvement. Third section discusses the pricing and risk analysis of annuity products with mortality improvement. Fourth section illustrates its application with historical data in China, and fifth section concludes this paper.
Model of mortality improvement
Andreev K and Vaupel J [3] assume that death rate at each age declines with time, determines reduction factor by extrapolation of a log-linear trend in death rates and forecast future death rates with most recent trend of such decline. Mao H, et al. [8] follow the approach and establish a model for mortality improvement of population in China as in (1) [13,14].
 (1)
(1)
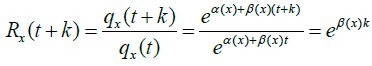
Where qx (t) is the death probability of the insured of age x in year t, Rx(t+k) is a mortality reduction factor at time (t+k) due to mortality improvement, and qx(t+k) is the death probability of the insured of age x at year (t+k).
Assume that
 (2)
(2)
Then
 (3)
(3)
and
 (4)
(4)
where t, px (t+k) is survival probability for the insured of age x at year (t+k). The reduction factor can then be derived as (5):
 (5)
(5)
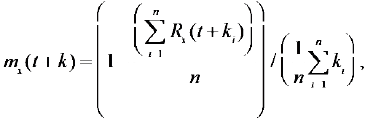
We find in equation (5) that α(x) is not related to reduction factor. Therefore, there is no need to estimate the value of α(x). With the help of mortality tables, the values of β(x) and the values of reduction factors Rx(t+k) can be determined. The forecasting average annual rate of mortality improvement can be written as in equation (6).
 (6)
(6)
where subscript x is age, ki= k + j - zi, j is calendar time for forecasting, zi is calendar time in Life Table i, and n is total number of Life Tables minus 1 Figure 1 and Figure 2 display the change patterns of mortality with ages for female and male in calendar years of 1990-1993, 2000-2003 and 2010- 2013, respectively. Figure 3 describes the mortality improvement at each age for both female and male in 2003 and 2013. We find from Figure 1 and Figure 2 that the speed of the decline of the mortality for female older than 80 years old is greater than that for male of the same age group. We also find that the mortality for both female and male is slightly greater for age group of 90 to 105 years old in 2000-2003 life Table than that in. 1990-1993 life Table. We find from Figure 3 that the change patterns of mortality improvement are quite different between female and male, and they are also quite different between the calendar year of 2003 and 2013. Comparing Figure 3 to Figure 1d we find that the change patterns of mortality improvement in China are more regular than that in England and Wales, in which the mortality improvement rates are very noisy and show considerable heteroscedasticity across ages. Therefore, we can expect that the uncertainty of mortality improvement forecasting will be smaller in Chinese case. Table 1 lists the mortality improvement rates calculated with 1990-1993, 2000-2003 and 2010-2013 Life Tables in China (Figure 3). [15].

Figure 1. Patterns of change of female mortality over time.

Figure 2. Patterns of change of male mortality over time.

Figure 3. Mortality improvement rates in 2003 and 2013.
| Age\Year | Male | Female | ||||||||
|---|---|---|---|---|---|---|---|---|---|---|
| 2018 | 2023 | 2028 | 2033 | 2038 | 2018 | 2023 | 2028 | 2033 | 2038 | |
| 45 | 0.0327 | 0.0290 | 0.0262 | 0.0239 | 0.0219 | 0.0400 | 0.0342 | 0.0301 | 0.0269 | 0.0243 |
| 50 | 0.0340 | 0.0292 | 0.0260 | 0.0234 | 0.0214 | 0.0425 | 0.0365 | 0.0321 | 0.0286 | 0.0257 |
| 55 | 0.0363 | 0.0302 | 0.0263 | 0.0233 | 0.0211 | 0.0442 | 0.0383 | 0.0338 | 0.0301 | 0.0270 |
| 60 | 0.0375 | 0.0335 | 0.0302 | 0.0273 | 0.0249 | 0.0441 | 0.0384 | 0.0350 | 0.0312 | 0.0280 |
| 65 | 0.0379 | 0.0347 | 0.0315 | 0.0286 | 0.0260 | 0.0435 | 0.0393 | 0.0351 | 0.0313 | 0.0281 |
| 70 | 0.0371 | 0.0346 | 0.0316 | 0.0287 | 0.0241 | 0.0413 | 0.0379 | 0.0341 | 0.0306 | 0.0276 |
| 75 | 0.0323 | 0.0305 | 0.0283 | 0.0261 | 0.0240 | 0.0375 | 0.0351 | 0.0320 | 0.0290 | 0.0263 |
| 80 | 0.0261 | 0.0228 | 0.0206 | 0.0188 | 0.0174 | 0.0304 | 0.0286 | 0.0266 | 0.0247 | 0.0229 |
| 85 | 0.0203 | 0.0170 | 0.0149 | 0.0135 | 0.0123 | 0.0244 | 0.0233 | 0.0220 | 0.0208 | 0.0195 |
| 90 | 0.0130 | 0.0123 | 0.0117 | 0.0113 | 0.0109 | 0.0201 | 0.0201 | 0.0194 | 0.0185 | 0.0176 |
| 95 | 0.0071 | 0.0073 | 0.0072 | 0.0072 | 0.0071 | 0.0156 | 0.0167 | 0.0166 | 0.0159 | 0.0152 |
Table 2 lists the uncertainty of mortality improvement for both male and female. Figures 4a and 4b display the change patterns of mortality improvement for female and male with age and calendar time. We find from Table 1, Figures 4a and b that the mortality improvement first increases and then decreases with age, and the mortality improvement decreases with the increase of calendar time for both female and male. Comparing the mortality improvement rate in Table 1 with that in Dionne and Gerbeau, we find that the mortality improvement of China is greater than that in Canada for the same time and the same age; the decreasing speed of mortality improvement with time in China is greater than that in Canada; the mortality improvement for female is greater than that for male in China, which is just opposite to the situation in Canada. We find from Figures 4a and 4b that the mortality improvement in advanced ages decreases rather greatly, especially in very old ages. This is different from what is illustrated and their estimates for life expectancy at age 80 show that there is remarkable improvement for survival at older ages in all KTDB countries [16]. Similar results by indicate that the death rates are falling now at very advanced ages (e.g., above 85 and even above 90) in developed countries. Finally, Table 2 indicates that the volatilities measured in standard deviation and variance coefficient decrease with the increase of projecting calendar year for both male and female; the standard deviation and variance coefficients of mortality improvement for female are smaller than those for male, the difference increases with the increase of projecting calendar year. Ione standard deviation confidence interval for the annual improvement of England and Wales is (0.0%, 4.0%), the expected value of mortality improvement is 2.0%, and its variation coefficient is 1. The results in Table 2 show that the variation coefficients of mortality improvement in Chinese situation are much smaller than that in England and Wales, especially for female of China (Tables 1 and 2) (Figures 4a and 4b).
| Age\Year | Male | Female | ||||||||
|---|---|---|---|---|---|---|---|---|---|---|
| 2018 | 2023 | 2028 | 2033 | 2038 | 2018 | 2023 | 2028 | 2033 | 2038 | |
| Std | 0.0137 | 0.0118 | 0.0103 | 0.0091 | 0.0081 | 0.0125 | 0.0100 | 0.0083 | 0.0070 | 0.0061 |
| Mean | 0.0296 | 0.0269 | 0.0241 | 0.0219 | 0.0200 | 0.0357 | 0.0325 | 0.0293 | 0.0264 | 0.0239 |
| Std/Mean | 0.4628 | 0.4387 | 0.4274 | 0.4155 | 0.4050 | 0.3501 | 0.3077 | 0.2833 | 0.2652 | 0.2552 |

Figure 4a. Mortality improvement for female and male for ages of 40 to 95 at 2018 and 2023.

Figure 4b. Mortality improvement for female and male for ages 45, 65 and 85 and the period 2018 to 2038.
The pricing model for annuity insurance and risk analysis of mortality improvement
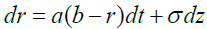
Mao H, et al. [16] have shown that optimal return with minimum guarantee is close to zero [17]. In fact, there is no minimum guaranteed return for the annuity products in the market of China. In this article, we assume that the annuity product is linked to investments, and the guaranteed return is zero. We also assume that interest rate of three years is a stochastic process following Vasicek model, and the net premium rate of annuity is discounted by this interest rate. This discounting rate follows equation (7).
 (7)
(7)
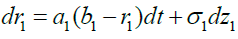
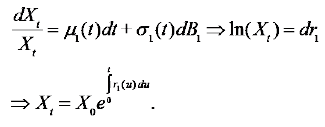
We assume that the return rate of investment for insurance industry in China also follows Vasicek model as in equation (8).
 (8)
(8)
In equation (7) and (8), σ and σ1 are the standard deviation for interest rate and return rate of insurance investment, respectively; b and b1 are the equilibrium interest rate and the equilibrium return rate of insurance investment in the long term, respectively; b-r(t) and b1-r1(t) are the gap between their current rate and their long-run equilibrium level; α and α1 measure the speed at which the gap diminish.
Annuity pricing and risk analysis of mortality improvement with single premium Immediate Annuity
Let Us be the net single premium rate for investment-linked immediate annuity without considering mortality improvement and Usk be the single premium rate with mortality improvement. Assume that the wealth process of annuity products without mortality improvement follows stochastic differential equation (9).
 (9)
(9)
The net premium rate can be written as in (10):
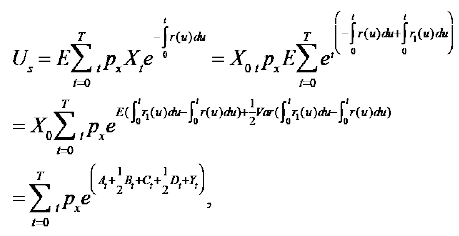 (10)
(10)
where T is the duration of the plan of insurance.
Assume that the wealth process of annuity with mortality improvement follows stochastic differential equation (11).
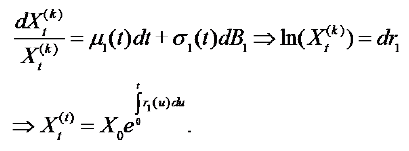 (11)
(11)
The net premium rate can be written as in (12).E denotes expectation.
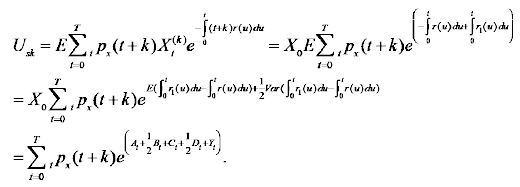 (12)
(12)
At and Bt in equations (9) and (11) satisfy equations (13) and (14).
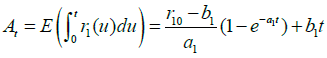 (13)
(13)
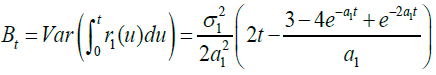 (14)
(14)
Ct, Dt and Yt in equations (9) and (11) satisfy equations (15), (16) and (17), respectively.
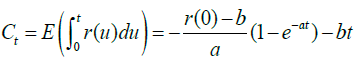 (15)
(15)
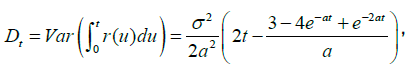 (16)
(16)
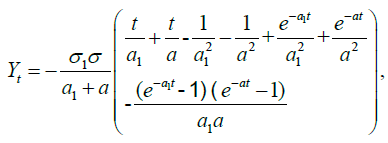 (17)
(17)
Where Yt is time-varying correlation coefficients between the price of insurance investment and discounting rate at time t for t = 0,1,2,L,T. Please refer to Mao and Wen (2017) and Mao (2018) for equations (13) through (17). Please see Appendix for the proof. X0 in equations (9) through (12) is assumed to be 1.
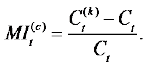
Let MIs be the cumulative relative payment risk of immediate annuity with single premium and be defined as in equation (18):
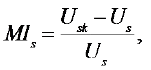 (18)
(18)
Where Us and Usk satisfy equations of (10) and (12), respectively.
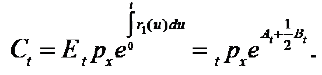
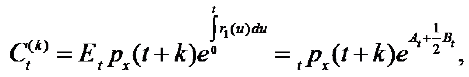
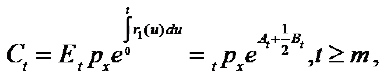
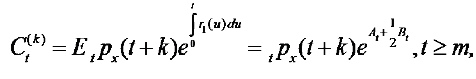
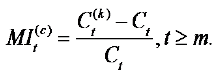
Let Ct be immediate annuity benefit without mortality improvement at time t(t > 1) if the insured is alive. Let  be that with mortality improvement. Let
  be the relative payment risk of immediate annuity at time t(t > 1). Then
we have:
be the relative payment risk of immediate annuity at time t(t > 1). Then
we have:
 (19)
(19)
 (20)
(20)
and
 (21)
(21)
Deferred annuity
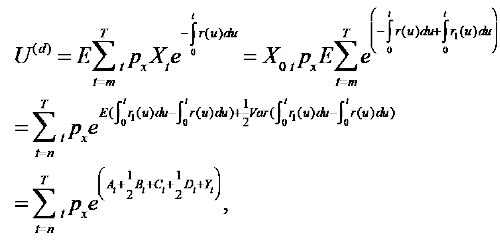
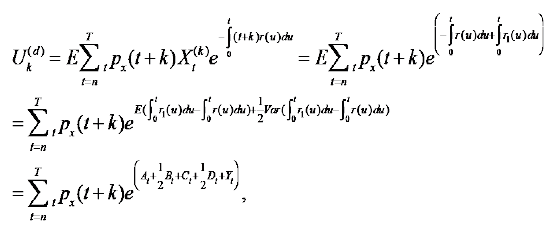
Let U(d) be the net single premium rate of investment-linked deferred annuity without considering mortality improvement,  be that with mortality
improvement. Let m be the beginning time for annuity distribution to the
insured and
be that with mortality
improvement. Let m be the beginning time for annuity distribution to the
insured and  be the cumulative relative payment risk of deferred annuity
with single premium. Then we have:
be the cumulative relative payment risk of deferred annuity
with single premium. Then we have:
 (22)
(22)
 (23)
(23)
Where At,Bt,Ct,Dt and Yt satisfy equations (13) through (17).
We also have,
 (24)
(24)
Where U(d) and  are given by equations of (18) and (19), respectively.
Let CDt be deferred annuity benefit without considering mortality
improvement at the end of time t if the insured is alive. Let  be that with
consideration mortality improvement. Let
be that with
consideration mortality improvement. Let  be the relative payment risk
of deferred annuity at time t. Then we have the following:
be the relative payment risk
of deferred annuity at time t. Then we have the following:
 (25)
(25)
 (26)
(26)
And
 (27)
(27)
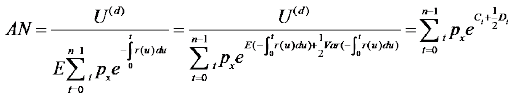
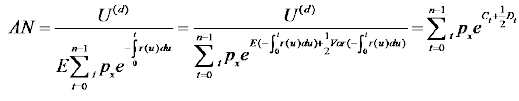
Pricing and risk analysis of mortality improvement for deferred annuity with level premium
Let AN be level net premium rate of deferred annuity without considering mortality improvement and ANk be that with consideration of mortality improvement. Let n be the period of level premium payment.
It can be easily shown that
 (28)
(28)
And
 (29)
(29)
Where U(d), Uk(d), Ct and Dt in equations (22) and (23) satisfy (19), (20), (15) and (16).
Let MIi be the cumulative relative payment risk with level premium defined as in equation (30).
 (30)
(30)
Where AN and ANk satisfy equations of (28) and (29), respectively
The formulae of annuity benefit with and without mortality improvement and relative payment risk at time t(t>m) are same as in equations (25), (26) and (27). Here we omit them.
Empirical annuity pricing and risk analysis with mortality improvement
We fit Vasicek model with the historical data of the investment return ratein insurance industry of China from 2000-2017 from Yearbooks of China’s Insurance and Phoenix Finance Web and deposit interest rate of three years of banks in China from 1979-2016. Table 3 lists the values for three parameters in Vasicek model and their estimation errors. According to the mandatory retirement ages in China, we set the age of the insured purchasing immediate annuity at 55 for female and 60 for male, and set the age of the insured purchasing 10 years’deferred annuity at 45 for female and 50 for male. Figure 5 shows the change pattern of the time-varying coefficient between the price of invested assets and deposit interest rate. Table 4 and Table 5 list the variable annuity paid to the insured if he (she) is alive and dynamical relative payment risk of mortality improvement for both female and male. We find from Figure 5 that time-varying correlation coefficient increases at first and then decreases with time. We find from Table 4 and Table 5 that the cumulative relative payment risk of mortality improvement increases with duration of insurance for both female and male. We also find from Table 4 and Table 5 that the cumulative relative payment risks of mortality improvement is greater for immediate annuity than that for deferred annuity except for whole life annuity. However, we find from Table 6 and Table 7 that the variable annuity paid to the insured increases with time. And the insured will get more annuity benefit for deferred annuity than that for immediate annuity due to time value of funds. The relative payment risk of mortality improvement for deferred annuity is less than that for immediate annuity although the annuity paid to the insured by the insurer for deferred annuity is much higher than that for immediate annuity. Therefore, in order to reduce the risk of mortality improvement, insurers should encourage their customers to purchase deferred annuity rather than immediate annuity. Alternatively, insurers can incorporate projections of mortality improvement in their life table so that they can reduce or avoid the risk of mortality improvement. By comparing the results listed in Table 4 through Table 7 to those in Zhu W and Chen B [9], we find that the net premium rate under our models is much higher than that of Zhu W and Chen B [9]; however, the variable annuity benefit is also much higher that of Zhu W and Chen B [9]. The reason lies in that our pricing models capture stochastic investment return and time-varying correlation between investment return and deposit interest, which we believe are very important; however, Zhu W and Chen B [9] neglect them. Finally, by comparing the results listed in Table 6 to those listed in Table 7, we find that the mortality improvement impacts the variable annuity benefit more for male than for female; the difference of the annuity benefit between female and male is getting greater with the time [18-22] (Table 3 and 7) (Figure 5).
| MLE China | Return rate of insurance investment in China | Estimation error | MLE China | Deposit rate for three years | Estimation error |
|---|---|---|---|---|---|
| Estimate (α1) | 0.4612 | 0.3178 | Estimate (α1) | 0.1441 | 0.0937 |
| Estimate (b1) | 0.0462 | 0.0032 | Estimate (b) | 0.0592 | 0.0049 |
| Estimate (σ1) | 0.012 | 0.000028 | Estimate (σ) | 0.0161 | 0.000031 |
| Immediate annuity with single premium x=55 | ||||||||||
|---|---|---|---|---|---|---|---|---|---|---|
| T | 10 | 20 | 30 | 40 | 50 | |||||
| Us | 10.5819 | 20.3471 | 27.9550 | 31.8060 | 32.1010 | |||||
| Usk | 10.6588 | 20.7792 | 29.5198 | 35.8199 | 38.9462 | |||||
| MIs | 0.0073 | 0.0212 | 0.0558 | 0.1262 | 0.1946 | |||||
| Deferred annuity with single premium x=45, m=10 | ||||||||||
| T | 20 | 30 | 40 | 50 | ||||||
| U(d) | 10.2386 | 19.2621 | 26.2227 | 29.7374 | ||||||
| Uk(4) | 10.3513 | 19.8829 | 28.4949 | 36.0203 | ||||||
| MIs(d) | 0.0110 | 0.0322 | 0.0866 | 0.2113 | ||||||
| Deferred annuity with level premium x=45, m=10 | ||||||||||
| T | 20 | 30 | 40 | 50 | ||||||
| AN | 0.9350 | 1.7590 | 2.3946 | 2.7156 | ||||||
| ANk | 0.9415 | 1.8084 | 2.5917 | 3.2761 | ||||||
| MIi | 0.0070 | 0.0281 | 0.0823 | 0.2064 | ||||||
| Immediate annuity with single premium x=60 | ||||||
|---|---|---|---|---|---|---|
| T | 10 | 20 | 30 | 40 | Whole life | |
| Us | 10.3281 | 18.9872 | 23.6742 | 24.6328 | 24.6561 | |
| Uk | 10.5518 | 20.1773 | 27.2996 | 30.7741 | 31.3199 | |
| MIs | 0.0217 | 0.0627 | 0.1531 | 0.2493 | 0.2703 | |
| Deferred annuity with single premium x=50, m=10 | ||||||
| T | 20 | 30 | 40 | Whole life | ||
| U(d) | 9.9969 | 18.0003 | 22.2894 | 23.1857 | ||
| Uk(4) | 10.1952 | 19.0256 | 25.3555 | 28.6581 | ||
| MIs(d) | 0.0198 | 0.0570 | 0.1376 | 0.2360 | ||
| Deferred annuity with level premium x=50, m=10 | ||||||
| T | 20 | 30 | 40 | Whole life | ||
| AN | 0.9226 | 1.6612 | 2.0571 | 2.1398 | ||
| ANk | 0.9331 | 1.7414 | 2.3207 | 2.6230 | ||
| MIi | 0.0115 | 0.0484 | 0.1282 | 0.2258 | ||
| Immediate annuity T=10, x=55 | |||||
|---|---|---|---|---|---|
| t | 1 | 2 | 3 | 4 | 5 |
| Ct | 1.1118 | 1.1667 | 1.2227 | 1.2800 | 1.3390 |
| Ct(k) | 1.1128 | 1.1691 | 1.2265 | 1.2857 | 1.3469 |
| MIt(c) | 0.0010 | 0.0020 | 0.0032 | 0.0044 | 0.0059 |
| t | 6 | 7 | 8 | 9 | 10 |
| Ct | 1.4000 | 1.4630 | 1.5282 | 1.5957 | 1.6656 |
| Ct(k) | 1.4104 | 1.4764 | 1.5452 | 1.6168 | 1.6914 |
| MIt(c) | 0.0074 | 0.0091 | 0.0111 | 0.0132 | 0.0156 |
| Deferred annuity T=20, x=45 | |||||
| t | 11 | 12 | 13 | 14 | 15 |
| Ct | 1.7871 | 1.8691 | 1.9544 | 2.0433 | 2.1357 |
| Ct(k) | 1.7888 | 1.8726 | 1.9603 | 2.0519 | 2.1475 |
| MIt(c) | 0.0009 | 0.0019 | 0.0030 | 0.0042 | 0.0055 |
| t | 16 | 17 | 18 | 19 | 20 |
| Ct | 2.2317 | 2.3314 | 2.4348 | 2.5420 | 2.6528 |
| Ct(k) | 2.2474 | 2.3516 | 2.4603 | 2.5737 | 2.6918 |
| MIt(c) | 0.0070 | 0.0086 | 0.0105 | 0.0125 | 0.0147 |
| Immediate annuity T=10, x=60 | |||||
|---|---|---|---|---|---|
| t | 1 | 2 | 3 | 4 | 5 |
| Ct | 1.1079 | 1.1584 | 1.2090 | 1.2602 | 1.3122 |
| Ct(k) | 1.1112 | 1.1656 | 1.2209 | 1.2774 | 1.3356 |
| MIt(c) | 0.0030 | 0.0062 | 0.0098 | 0.0136 | 0.0179 |
| t | 6 | 7 | 8 | 9 | 10 |
| Ct | 1.3650 | 1.4186 | 1.4731 | 1.5282 | 1.5837 |
| Ct(k) | 1.3957 | 1.4577 | 1.5218 | 1.5881 | 1.6565 |
| MIt(c) | 0.0225 | 0.0275 | 0.0331 | 0.0392 | 0.0460 |
| Deferred annuity T=10, x=50 | |||||
| t | 11 | 12 | 13 | 14 | 15 |
| Ct | 1.7810 | 1.8557 | 1.9327 | 2.0118 | 2.0928 |
| Ct(k) | 1.7859 | 1.8665 | 1.9503 | 2.0373 | 2.1277 |
| MIt(c) | 0.0028 | 0.0058 | 0.0091 | 0.0127 | 0.0166 |
| t | 16 | 17 | 18 | 19 | 20 |
| Ct | 2.1759 | 2.2607 | 2.3470 | 2.4344 | 2.5226 |
| Ct(k) | 2.2215 | 2.3186 | 2.4192 | 2.5232 | 2.6305 |
| MIt(c) | 0.0209 | 0.0256 | 0.0308 | 0.0365 | 0.0428 |

Figure 5. Time-varying correlation coefficient between the price of invested assets and discounting rate.
In this paper, we present pricing models for investment-linked immediate and deferred annuity considering mortality improvement and we also take into account the cyclical changes and time-varying correlations of investment return and credited interest rate of three years. We demonstrate their empirical applications with historical data from China. Our results indicate that the cumulative relative payment risk of mortality improvement increases with duration of insurance for both female and male; that the cumulative relative payment risk of mortality improvement is greater for immediate annuity than that for deferred annuity except for whole life annuity. We find that the mortality improvement impacts the variable annuity benefit more for male than for female; the difference of the annuity benefit between female and male is getting greater with the time. In China, traditionally, the annuity products take the pricing strategy with fixed interest rate. In this paper, we use dynamic interest rate and consider mortality improvement risk. As a well-known fact, population of China has experienced significant improvement in longevity. The rate of mortality improvement has been faster than that in most developed countries. China used to be very conservative about capital market and implemented conservative investment regulations and pre-determined interest rate. As China has opened up its financial markets, interest rate credited has been allowed to fluctuate with market, and tight regulations have been gradually loosened up. As a result, insurance companies in China face both interest rate risk and mortality improvement risk. In this paper, we give our solution for risks associated with mortality improvement and dynamics of interest rate. This won’t be our last paper in this direction; we believe with more accumulation of data in China, we can model these dynamic processes more accurately.
The proof of the formulas for Bt and Dt
Based on Mamon (2004), we have:
Google Scholar, Indexed at, Crossref
Google Scholar, Indexed at, Crossref
Google Scholar, Indexed at, Crossref
Google Scholar, Indexed at, Crossref
Google Scholar, Indexed at, Crossref
Google Scholar, Indexed at, Crossref
Google Scholar, Indexed at, Crossref
Google Scholar, Indexed at, Crossref
Google Scholar, Indexed at, Crossref
Google Scholar, Indexed at, Crossref
Google Scholar, Indexed at, Crossref
Business and Economics Journal received 6451 citations as per Google Scholar report


