Research Article - (2024) Volume 15, Issue 3
Received: 27-May-2024, Manuscript No. jbmbs-24-137283;
Editor assigned: 29-May-2024, Pre QC No. P-137283;
Reviewed: 12-Jun-2024, QC No. Q-137283;
Revised: 17-Jun-2024, Manuscript No. R-137283;
Published:
24-Jun-2024
, DOI: 10.37421/2155-6180.2024.15.221
Citation: Zhang, Yinuo and Shein-Chung Chow. “On Power
Calculation Based on Effect Size in Clinical Research.” J Biom Biosta 15 (2024):
221.
Copyright: © 2024 Zhang Y, et al. This is an open-access article distributed under the terms of the Creative Commons Attribution License, which permits unrestricted use, distribution, and reproduction in any medium, provided the original author and source are credited.
Power analysis for sample size calculation (power calculation) plays an important role in clinical research to guarantee that we have sufficient power for detecting a clinically meaningful difference (treatment effect) at a pre-specified level of significance. In practice, however, there may be little or no information regarding the test treatment under study available. In this case, it is suggested that power calculation for detecting an anticipated effect size adjusted for standard deviation be performed, reducing a two-parameter problem into a single parameter problem by taking both mean response and variability into consideration. This study systematically analyzes estimating sample sizes across diverse endpoints, including relative/absolute change, risk metrics, exponential and proportional hazards models. Findings underscore the distinct nature of these metrics, reinforcing the necessity of an effect size measure as a standardized framework. Notably, analysis suggests it is possible to translate continuous and binary outcomes through a common effect size metric, which could facilitate meta-analyses involving heterogeneous outcome types. However, extending such translations to time-to-event outcomes presents additional complexities warranting advanced modeling techniques and hazard-based metrics. Through critical examination of effect size-based power calculations, this study contributes insights into efficient sample size estimation. It highlights the importance of standardized effect sizes as a unifying measure and the potential for outcome translation across endpoints.
Treatment effect • Effect size • Power analysis for sample size calculation
Power calculation, also known as sample size estimation, is a crucial step in the design of clinical trials. It involves determining the number of participants required to detect a statistically significant effect of the treatment under investigation, given a specified level of significance and desired power [1]. The importance of proper sample size selection in clinical trials cannot be overstated. A study with an inadequate sample size may lack the statistical power to detect clinically meaningful treatment effects, leading to inconclusive or misleading results. Conversely, an excessively large sample size may result in undue exposure of participants to experimental treatments, increased costs, and potential ethical concerns [2]. In practice, power calculation can be a challenging task, especially when the investigational treatment is new and/or when there is limited information available regarding specific parameters of the test treatment under study. In such cases, the traditional approach of using the mean and standard deviation for power calculation may not be applicable or reliable.
Power calculation based on effect size offers a viable solution to this challenge. By focusing on the standardized effect size, a dimensionless measure of the magnitude of the treatment effect, the problem is reduced from estimating two parameters (mean and standard deviation) to estimating a single parameter (standardized effect size). This approach has several advantages:
a. It simplifies the calculation process, making it more efficient and requiring less information about the specific parameters of the study.
b. It can be applied to various study endpoints, such as relative change, absolute change, responder analysis and survival analysis, providing flexibility in the analysis of clinical trial data [3].
c. It facilitates comparison and synthesis of results across different studies and outcome measures, as effect sizes provide a standardized metric [4].
In this study, we aim to provide a systematic review and analysis of how power calculation based on standardized effect size can aid in sample size estimation for different study endpoints and in various clinical trial settings. By exploring the practical applications and implications of this approach, we seek to contribute to the understanding and implementation of efficient and reliable power calculations in clinical research. In the below session will delve into the formulation of hypotheses and sample size determination using standardized effect size in clinical trials, laying the groundwork for our methodology. In below session numerical analysis provides insights into estimating treatment effects for various endpoints, including relative change, absolute change, absolute risk, relative risk, exponential model and Cox's proportional model. We engage in a thorough discussion, critically examining the findings from our numerical analysis and considering their implications for clinical trial design and analysis. This includes a discussion on the limitations and potential areas for future research. Finally, it presents our concluding remarks, summarizing the study's key findings and their implications for the field of clinical research. We reflect on how our study contributes to a better understanding of the use of standardized effect sizes in power calculations and sample size estimation, offering recommendations for researchers looking to implement these methods in their clinical trials.
Formulation of hypotheses and sample size determination using standardized effect size in clinical trials
To ensure the simplicity and broad applicability of our methodological framework, several foundational assumptions have been established. Firstly, the model presupposes the absence of interaction or confounding variables, which may otherwise distort the estimated effects of the treatments under consideration. Secondly, the design of choice is a two-sided, one-sample parallel configuration. This design is particularly advantageous for regulatory approval processes, such as those employed by the Food and Drug Administration (FDA), due to its robustness and the comprehensive nature of the comparative insights it provides [3]. Thirdly, we assume an equal allocation of subjects across treatment arms, which facilitates a balanced comparison and enhances the statistical power of the trial. Lastly, the assumption of equal variance across groups is adopted, ensuring that any observed differences in treatment effects can be attributed with greater confidence to the treatments themselves rather than to underlying variability in the populations studied. These assumptions are integral to the integrity of the statistical analysis and are reflective of standard practices within clinical trial methodology.
Continuous (Comparing means) and binary (Comparing proportions)
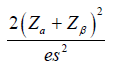
Test for equality: The trial aims to test if there is a difference as compared to an active control. The hypothesis often considered is
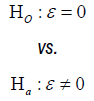
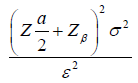
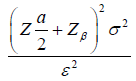
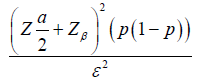
Where  is the true mean difference between a test drug (µT) and active control agent (µR). Without loss of generality, consider ε > 0 as an indication of improvement (worsening) of the test drug as compared to the active control agent. The general power calculation for the required sample size per group N is given by:
 Equation (1.1) [3]
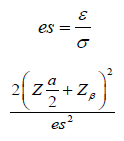
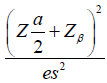
Where α is the significance level and β is the probability of making type II errors. For simplicity, we assume  . Based on Cohen’s d (Standardized mean difference), Equation (1.1) can be rewritten as:
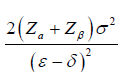
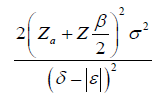
Test for non-inferiority/superiority: The trial aims to test the non-inferiority/superiority as compared to an active control. The hypothesis often considered is:

The test of noninferiority and superiority can be unified with the above hypothesis,
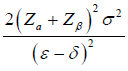
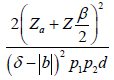
where ε= µT - µR and δ is the noninferiority or superiority margin. With a , the rejection of the null hypothesis shows the superiority of the treatment group; With , the rejection of the null hypothesis shows the no inferiority of the treatment group. The general power calculation for the required sample size per group N is given by:
 Equation (1.2) [3]
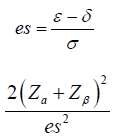
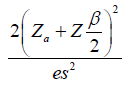
Equation (1.2) can be rewritten as:
Test for equivalence: The trial aims to test the equivalence as compared to an active control. The hypothesis often considered is

The general power calculation for the required sample size per group N is given by:
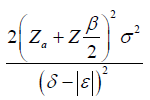 Equation (1.3) [3]
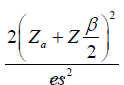
Equation (1.3) can be rewritten as:
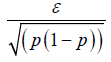
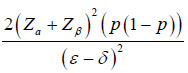
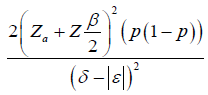
Binary: The derivation of binary endpoints proceeds analogously to that of continuous endpoints. For binary outcomes, the effect size (ε) is defined as the difference in proportions, such that  , where p and p0 represent the probabilities of success in the treatment and a reference value, respectively.
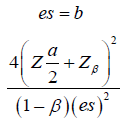
Time to event (Cox’s proportional hazards model)
Test for equality: In practical applications, it is most common to evaluate two treatments by considering only the treatment indicator as the solitary covariate without making adjustments for additional covariates [3], to test for equality of two survival curves, the following hypotheses are usually considered:
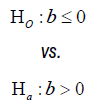
Where 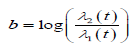 . The general power calculation for the required sample size per group N is given by:
 Equation 2.1 [3]
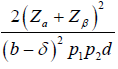
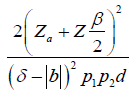
Where d is the probability of observing an event and pi is the proportion of patients in the ith treatment group. We assume d = 0.8 and p1=p2=0.5 for simplicity, Equation (2.1) can be rewritten as:
Test for Non-inferiority/superiority: To test for noninferiority and superiority of two survival curves, the following hypotheses are usually considered:
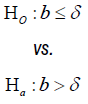
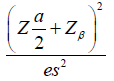
The general power calculation for the required sample size per group N is given by:
 Equation 2.2 [3]
Equation (2.2) can be rewritten as:

Test for equivalence: To test for equivalence of two survival curves, the following hypotheses are usually considered:
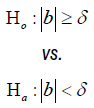
The general power calculation for the required sample size per group N is given by:
 Equation 2.3 [3]
Equation (2.3) can be rewritten as:
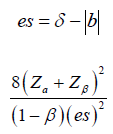
Table 1 provides a summary of the requisite formulas for computing sample size, predicated upon the establishment of a clinically meaningful difference and the quantification of the standardized effect size.
| Test for Equality | |||||
|---|---|---|---|---|---|
| Endpoint | Hypothesis | Treatment Effect | Clinically Meaningful Difference (Treatment Effect) |
Effect Size (ES) |
Effect Size (N) |
| Continuous |  |
 |
 |
 |
 |
| Binary |  |
|
 |
 |
 |
| Time-to-event |  |
b | 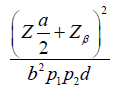 |
b | 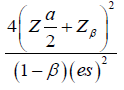 |
| Test for Non-inferiority/Superiority | |||||
| Endpoint | Hypothesis | Treatment Effect | Clinically Meaningful Difference (Treatment Effect) |
Effect Size (ES) |
Effect Size (N) |
| Continuous |  |
|
 |
 |
 |
| Binary |  |
|
 |
 |
 |
| Time-to-event |  |
b |  |
 |
 |
| Test for Equivalence | |||||
| Endpoint | Hypothesis | Treatment Effect | Clinically Meaningful Difference (Treatment Effect) | Effect Size (ES) | Effect Size (N) |
| Continuous |  |
 |
 |
 |
 |
| Binary |  |
|
 |
 |
 |
| Time-to-event | 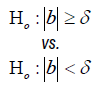 |
 |
 |
 |
 |
Numerical analysis
In the numerical analysis of our study, we explore the intricacies of estimating the treatment effect for different endpoints, specifically delving into the nuances of relative change, absolute change, absolute risk, relative risk, exponential model and cox’s proportional model and their impact on the determination of sample size in clinical trials. Our findings underscore the distinct nature of these metrics and illustrate that they are not readily translatable into one another, further reinforcing the necessity of a standardized measure effect size.
Continuous endpoint: The simulation was grounded on following assumptions: a significance level (α) of 0.05 for a 95% confidence threshold, a Type II error rate (β) of 0.20 for an 80% power, a standard deviation of outcomes (σ) set at 15, and a mean outcome of 150 in the control group.
In Table 2, we present the outcomes of our simulation for the test for equality. This Table illustrates the effects of varying treatment magnitudes on both absolute and relative change effect sizes, as well as their corresponding sample sizes. This approach serves as an example, highlighting the unique characteristics of absolute and relative changes and how they do not necessarily translate directly into one another. Similar procedures can be applied to reproduce other tests, providing insights into the distinct impacts of treatments across different metrics.
| Treatment Effect | Absolute Change Effect Size | Absolut Change Sample Size | Relative Change Effect Size | Relative Change Sample Size |
|---|---|---|---|---|
| 0.5 | 0.03 | 14128 | 0.05 | 6280 |
| 1.0 | 0.07 | 3532 | 0.10 | 1570 |
| 1.5 | 0.10 | 1570 | 0.15 | 698 |
| 2.0 | 0.13 | 883 | 0.20 | 393 |
| 2.5 | 0.17 | 566 | 0.25 | 252 |
| 3.0 | 0.20 | 393 | 0.30 | 175 |
| 3.5 | 0.23 | 289 | 0.35 | 129 |
| 4.0 | 0.27 | 221 | 0.40 | 99 |
| 4.5 | 0.31 | 175 | 0.45 | 78 |
| 5.0 | 0.34 | 142 | 0.50 | 63 |
| 5.5 | 0.37 | 117 | 0.55 | 52 |
| 6.0 | 0.41 | 99 | 0.60 | 44 |
| 6.5 | 0.44 | 84 | 0.65 | 38 |
| 7.0 | 0.47 | 73 | 0.70 | 33 |
| 7.5 | 0.50 | 63 | 0.75 | 28 |
| 8.0 | 0.53 | 56 | 0.80 | 25 |
| 8.5 | 0.57 | 49 | 0.85 | 22 |
| 9.0 | 0.60 | 44 | 0.90 | 20 |
| 9.5 | 0.63 | 40 | 0.95 | 18 |
| 10.0 | 0.67 | 36 | 1.00 | 16 |
| 10.5 | 0.70 | 33 | 1.05 | 15 |
| 11.0 | 0.73 | 30 | 1.10 | 13 |
| 11.5 | 0.77 | 27 | 1.15 | 12 |
| 12.0 | 0.81 | 25 | 1.20 | 11 |
| 12.5 | 0.83 | 23 | 1.25 | 11 |
| 13.0 | 0.87 | 21 | 1.30 | 10 |
| 13.5 | 0.91 | 20 | 1.35 | 9 |
| 14.0 | 0.93 | 19 | 1.40 | 9 |
| 14.5 | 0.97 | 17 | 1.45 | 8 |
| 15.0 | 1.00 | 16 | 1.50 | 15.0 |
Table 3 and 6 display effect sizes for estimating sample sizes within the range of 0.2 to 0.8, aligning with the FDA's recognized range of effectiveness [5]. Table 3 provides uniform sample size calculations for both continuous and binary endpoints applying the formula from Table 1.
| Effect Size | Equality (N) | Non-inferiority/Superiority (N) | Equivalence (N) |
|---|---|---|---|
| 0.20 | 197 | 310 | 429 |
| 0.25 | 126 | 198 | 275 |
| 0.30 | 88 | 138 | 191 |
| 0.35 | 65 | 101 | 140 |
| 0.40 | 50 | 78 | 108 |
| 0.45 | 39 | 62 | 85 |
| 0.50 | 32 | 50 | 69 |
| 0.55 | 26 | 41 | 57 |
| 0.60 | 22 | 35 | 48 |
| 0.65 | 19 | 30 | 41 |
| 0.70 | 17 | 26 | 35 |
| 0.75 | 14 | 22 | 31 |
| 0.80 | 13 | 20 | 27 |
Binary endpoint: We assume that a baseline event probability in the control group (p0) at 0.1, representing the probability of the event occurring without treatment intervention with a significance level (α) of 0.05 and a Type II error rate (β) of 0.20.
The Odds Ratio (OR) is a critical statistic for assessing relative risk in binary outcome studies. It is a non-negative value, typically ranging up to 4, where an OR of 1, corresponding to equal probabilities of an event in treatment and control groups, indicates no effect. An OR between 1 and 4 suggests a higher likelihood of the event occurring in the treatment group compared to the control group [3] (Table 4).
| Treatment Effect | Absolute Risk Effect Size | Absolute Risk Sample Size | Odds Ratio Effect Size | Odds Ratio Sample Size |
|---|---|---|---|---|
| 0.1 | 0.25 | 252 | 1.67 | 6 |
| 0.2 | 0.44 | 83 | 1.88 | 5 |
| 0.3 | 0.61 | 42 | 1.82 | 5 |
| 0.4 | 0.80 | 25 | 1.67 | 6 |
| 0.5 | 1.02 | 16 | 1.50 | 7 |
| 0.6 | 1.31 | 10 | 1.35 | 9 |
| 0.7 | 1.75 | 6 | 1.21 | 11 |
| 0.8 | 2.67 | 3 | 1.10 | 14 |
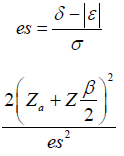
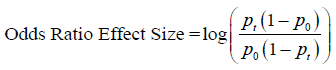
The effect size based on the odds ratio is often expressed in a logarithmic form, primarily to symmetrize the distribution and facilitate the application of standard statistical methods. The formula to compute the effect size for the odds ratio is as follows:
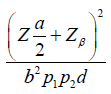
Time-to-event endpoint: We assume a baseline hazard rate, λ1(t), of 0.5 for the control group, indicating the risk of event occurrence without treatment. For the treatment group, the hazard rate, λ2(t), is conceptualized as 0.5+"treatment effect". These assumptions underpin the comparative analysis between control and treatment groups.
In our comparison, we utilized the Exponential Model, which posits a consistent hazard rate over time. Let be the difference between the hazard rates of a control and a test drug, which is the effect size here [3] (Tables 5 and 6).
| Treatment Effect | Exponential Effect Size | Exponential Sample Size | Cox Effect Size | Cox Samples Size |
|---|---|---|---|---|
| 0.5 | 0.5 | 126 | 0.69 | 82 |
| 1.0 | 1.0 | 32 | 1.10 | 33 |
| 1.5 | 1.5 | 14 | 1.39 | 21 |
| 2.0 | 2.0 | 8 | 1.61 | 16 |
| 2.5 | 2.5 | 6 | 1.79 | 13 |
| 3.0 | 3.0 | 4 | 1.95 | 11 |
| 3.5 | 3.5 | 3 | 2.08 | 10 |
| 4.0 | 4.0 | 2 | 2.20 | 9 |
| Effect Size | Equality(N) | Non-inferiority/Superiority (N) | Equivalence (N) |
|---|---|---|---|
| 0.20 | 982 | 1546 | 2141 |
| 0.25 | 628 | 990 | 1371 |
| 0.30 | 437 | 687 | 952 |
| 0.35 | 321 | 505 | 700 |
| 0.40 | 246 | 387 | 536 |
| 0.45 | 194 | 306 | 423 |
| 0.50 | 157 | 248 | 343 |
| 0.55 | 130 | 205 | 284 |
| 0.60 | 110 | 172 | 238 |
| 0.65 | 93 | 147 | 203 |
| 0.70 | 81 | 127 | 175 |
| 0.75 | 70 | 110 | 153 |
| 0.80 | 62 | 97 | 134 |
The numerical analysis highlights the intricate relationships between effect size metrics and their distinct characteristics across different study endpoints. While absolute change, relative change, absolute risk and relative risk represent alternative ways to quantify treatment effects, our findings underscore their incommensurable nature, even when applied to the same dataset. This divergence becomes more pronounced as the treatment effect increases, underscoring the limitations of relying solely on a single metric to assess efficacy comprehensively. Interestingly, our analysis suggests a potential avenue for translating continuous and binary outcomes through a common effect size metric. By standardizing the treatment effect using appropriate scaling factors (e.g., standard deviation for continuous outcomes, baseline event rate for binary outcomes), it may be possible to derive a unified effect size measure that facilitates comparisons across diverse endpoints. This approach could prove valuable in meta-analyses and evidence synthesis efforts, where combining results from studies with varying outcome types is often necessary.
However, the translation between continuous, binary, and time-to-event outcomes presents additional challenges. While the exponential model and Cox's proportional model both capture the treatment effect on event occurrence, their effect size interpretations and underlying assumptions differ. Exploring methods to bridge these gaps, perhaps through the use of common hazard-based metrics or advanced modeling techniques, could be a fruitful area for future research. It is important to acknowledge the limitations of our analysis. The simulations were based on specific assumptions, such as equal variances across groups, absence of confounding variables, and equal allocation of subjects. Deviations from these assumptions in real-world scenarios may impact the accuracy of sample size calculations and effect size estimates. Additionally, our analysis focused on a subset of effect size metrics and study endpoints; other metrics or more complex study designs may warrant further investigation.
This study underscores the pivotal role of effect sizes in power calculations and sample size estimation for clinical trials. By highlighting the distinct nature of various effect size metrics and the challenges associated with translating findings across different endpoint types, our analysis reinforces the value of a standardized effect size measure as a unifying framework. The potential for translating continuous and binary outcomes through a common effect size metric represents a promising avenue for future exploration. Developing robust methods for such translations could facilitate more comprehensive meta-analyses and evidence synthesis efforts, ultimately enhancing our understanding of treatment efficacy across diverse clinical contexts. While the translation between continuous, binary, and time-to-event outcomes presents additional complexities, continued research into advanced modeling techniques and common hazard-based metrics may yield valuable solutions. Addressing these challenges could further refine the accuracy of sample size determination and facilitate more meaningful comparisons across clinical trials employing different endpoint types.
As clinical research continues to evolve, the insights gained from this study contribute to a deeper understanding of the complexities involved in power calculations and sample size estimation. By highlighting the importance of a standardized effect size measure and the potential for translating outcomes, this work informs more robust and efficient clinical trial design and analysis, ultimately advancing our ability to develop and evaluate safe and effective medical interventions.
None.
The authors declare that there is no conflict of interests regarding the publication of this article.
Google Scholar, Crossref, Indexed at
Google Scholar, Crossref, Indexed at
Journal of Biometrics & Biostatistics received 3496 citations as per Google Scholar report


