Research Article - (2022) Volume 13, Issue 7
Received: 02-May-2022, Manuscript No. JHMI-22-62551;
Editor assigned: 05-May-2022, Pre QC No. JHMI-22-62551(PQ);
Reviewed: 20-May-2022, QC No. JHMI-22-62551;
Revised: 02-Jul-2022, Manuscript No. JHMI-22-62551(R);
Published:
11-Jul-2022
, DOI: 10.37421/2157-7420.2022.13.426
Citation: Stephen, Appiah and Adebayo Felix Adekoya.
"Performance Analysis of Data Mining Algorithms: Breast
Cancer Predictive Models ." J Health Med Informat 13 (2022): 426.
Copyright: © 2022 Stephen A, et al. This is an open-access article distributed under the terms of the creative commons attribution license which permits
unrestricted use, distribution and reproduction in any medium, provided the original author and source are credited.
One out of eight women over their lifetime will be diagnosed of breast cancer and it is recorded to be the world major cause of women’s deaths. Data mining methods are an effective way to classify data, especially in medical field, where those methods are widely used in diagnosis and analysis to make decisions. In this study, a performance comparison between five different data mining technique: Random forest, random tree, Bayes net, Naïve Bayes and J48 on the breast cancer Wisconsin (Diagnostic) data set is conducted. It is aimed to assess the correctness in classifying data with respect to efficiency and effectiveness of each algorithm in terms of accuracy, precision, sensitivity/recall and specificity. Experimental outcome indicates that Bayes net and random forest gives the highest weighted average accuracy of 97.1% with lowest type I and II error rate. All experiments conducted in WEKA data mining tool.
Analysis • Accuracy • Breast cancer • Experiment • Data mining • Performance • Precision • Sensitivity • Specitivity
During cell development in humans, cells develop as benign which has no negative effect on human but becomes very suspicious when this growth happens in the breast of human. Benign in the breast conditions are unusual growths or changes in the breast tissue that are not cancer.
benign breast condition can be scary at first because the symptoms often mimic those caused by breast cancer. Although any lump formed by body cells may be referred to technically as a tumor. Not all tumors are malignant (cancerous). Most breast lumps–80% of those biopsied are benign (non-cancerous) and most breast lumps are benign tumors [1]. The diagnosis has always been a major problem in the medical field, based on various tests conducted on various patients. Tests are meant to aid the physician in making a proper and accurate diagnosis. However, miss diagnosis sometimes occurs, especially in tumor and cancerous cells since it can be difficult to make an accurate diagnosis, even for a medicinal cancer expert [2]. One of the drifting issues in the medicinal field is a diagnosis of the tumors. But early detection needs an accurate and reliable diagnosis procedure that allows doctors to differentiate benign breast tumors from malignant ones without going for surgical biopsy.
Breast cancer predictive model is investigation of the performance criterion of an artificial intelligence and machine learnings and several other for prediction, prognosis, detection and diagnosis of breast cancer. Data Mining (DM) is process of knowledge discovery in databases in which intelligent methods are applied in order to extract patterns. DM is set of techniques and tools applied to the non-trivial process of extracting and illustrating implicit knowledge, previously unknown, potentially useful and humanly coherent, from large data sets. A predictive model makes a prediction about values of data using known results found from different data as cited by Kharya S [3]. Data mining is the branch of computer science that used with bioinformatics for analysing and classification biological data. The classification, clustering and other data mining methods can be exploited in combination with bioinformatics to leverage understanding of biological processes [4].
There are many data mining techniques for classification and forecast of BC outcome as Benign or Malignant [5]. In evaluation these algorithms different datasets are used by researchers to evaluate their performance.
Performance of a predictive models depend on the dataset and environment. The aim of this study is to evaluate the performance of Random Forest, Random Tree, Bayes Net, Naïve Bayes and J48 on Wisconsin Breast Cancer Diagnosis (WBCD) Dataset from UCI Machine Learning Repository created by Dr. William H. Wolberg at University of Wisconsin-Madison, US around the year 1989 and 1991 in terms of: Sensitivity, Specificity, Accuracy and Precision with a simulating environment Waikato Environment for Knowledge Analysis (WEKA). The WEKA is a collection of state-of-the-art machine learning algorithms and data pre-processing tool
Breast cancer prevalence
Breast Cancer (BC) is reported to be second principal cause of loss of life in women today, [6-18]. BC is the most commonly diagnosed disease among ladies. According to the reported work by Mihaylov I stated that, one out of eight women over their lifetime will be diagnosed of BC [19]. The report by Kumar V showed that, people used to say everyone knows someone living with breast cancer. This statement clearly indicate that BC is common among female gender. In this paper author, reported that BC is one of the most destructive disease among all of the diseases in medical science [20]. In the authors presented 18 cases of breast cancer for a very small community in Ghana in their work on a knowledge base of prevalent diseases in the original dataset report. It has been recorded by Kharya S and Soni S, that every 19 seconds somewhere around the globe a case of breast cancer is diagnosed among women and every 74 seconds a female pass on from breast cancer globally.
Related work
Academic scholars have put great efforts in investigating into BC and coming out with several solution/predictive model which are adequate, effective and efficient in bringing BC cases close to zero. According to Kharya S and Soni S explored two data mining techniques: Weighted Naive Bayes and Naïve Bayes in accurate, and reliable diagnostic for detection of breast cancer in India, experimental results showed that Weighted Naive Bayes approach performs better in effective way to reduce breast cancer death by early detection.
Succinctly in India, focused on robust system for early and perfect detection of cancer with lowest subset of features of the cancer cells. After applying logistic regression, Naïve Bayes and decision tree on same dataset. It was obvious that logistic regression classifier was the best classifier with the highest accuracy as compared to the other two classifiers. A comparative study done by Asri H, which was focused on correctness in classifying data with respect to efficiency and effectiveness of each algorithm in terms of these four parameters accuracy, precision, sensitivity and specificity. The report indicated that, SVM outperforms the other classifiers (NB, C 4.5 and k-NN) with respect to accuracy, sensitivity, specificity and precision in classifying breast cancer dataset.
According to Kharya S focused on BC prediction system using Naïve Bayes classifiers that can be used in making expert decision with maximum accuracy, Naïve Bayes classifiers proved with high accuracy with low computational complexity. developed two-step- SVM technique for diagnostic method for breast tumor disease using hybrid SVM, experimental results showed that the proposed two step-SVM obtained high accuracy of 99.1%.
In a paper by Sankareswari MSA and Phil M investigated out the best classifier with respect to accuracy on three different databases of breast cancer (WBC, WDBC and WPBC) by using classification accuracy method, SVM proved 96.99% accuracy
In the paper by Bazila BA and Ponniah T presented a report on the performance of Bayes classifiers Tree Augmented Naive (TAN) Bayes, Boosted Augmented Naïve (BAN) Bayes and Bayes Belief Network (BBN) [21]. The study reveals that TAN Bayes Classifier along with Gradient Boosting delivers the maximum accuracy with reduced Mean Squared Error when compared to BBN and BAN.
A surveyed done by Bazila BA and Ponniah T on researches, presented the importance and usefulness of different data mining techniques such as classification, clustering, Decision Tree, Naive Bayes in health domain. It was found that data mining approach is a boon to health care systems. These approaches are capable enough in finding critical hidden patterns for the identification of disease and interrelationships among various parameters causing the deadly disease such as cancer.
Sun W developed a graph based Semi-Supervised Learning (SSL) scheme using deep Convolutional Neural Network (CNN) for breast cancer diagnosis [22]. The paper indicated that, the MDS has the best performance when we set the value of reduced dimension to 9, and generally MDS and PCA have very similar performance
Disha P summarized various review and technical articles on predicting breast cancer. The study were done on clustering algorithm (K-means, EM, PAM, Fuzzy C-means) and the paper concluded that, EM performs better in term of using confusion matrix in accuracy, sensitivity and specificity [23].
Prasuna K discussed breast cancer in women and several machine learning techniques proposed by the researchers in diagnosing the disease [24]. Based on the analysis presented in the paper, SVM classifier combined with feature selection provides highest accuracy in predicting the disease outcome
In the paper by Aavula R presented the state of the art of breast cancer prognosis which includes breast cancer diagnosis, breast cancer risk prediction and breast cancer survivability prediction. The paper provided insights into different methods of prognosis including diagnosis, risk prediction and survival
Asfaw TA aimed to advance the prediction of breast cancer in demand to increase the accuracy of diagnosis. The result outcome shows that Logistic Regression performs better and classification accuracy is 96.93% [25,26]. Kourou K reviewed recent ML approaches employed in the modeling of cancer progression. Based on the analysis of their results, it was evident that the integration of multidimensional heterogeneous data, combined with the application of different techniques for feature selection and classification can provide promising tools for inference in the cancer domain.
Malgwi Y evaluated different classifier algorithm (k-NN, J48, Decision table, Decision stump, and Naïve Bayes) in order to find the best among them using multi-agent platform and MySQL for the diagnosis of breast tumors based on associated symptoms and risk factors of cancer diseases. The analysis revealed that k-NN classifier has a greater performance capability over other classification algorithms [27].
Kaya Keles M presented a comparison of the largely popular machine learning algorithms and techniques commonly used for breast cancer prediction, namely Random Forest, kNN (k-Nearest- Neighbor) and Naïve Bayes [28]. It was recorded that Random Forest has the best sensitivity performance measure but k-NN has the best accuracy, precision.
A. Witteveen presented accurate prediction of Loco-Regional Recurrence (LRR) and Second Primary (SP) breast cancer risk [29]. The result presented that, the three classifier: Logistic Regression, Linear Regression and SVM. SVM accuracy is much better than the other classification algorithms
R. A. Khan numerous types of classification algorithms used with feature optimization algorithms to differentiate between two types of breast tumor. The analysis suggests that regression is still more accurate [30].
Wisconsin Breast Cancer Diagnosis (WBCD) dataset
The Wisconsin breast cancer (original) datasets link to the data (UCI) from the UCI machine learning Repository is used in this study. WBCD has 699 instances 2 classes 34.5% Malignant (M) and 65.5% Benign (B), and 11 attributes. The data was created by Dr. William H. Wolberg at University of Wisconsin-Madison, US around the year 1989 and 1991. Sample of the data is tabled with 10 variable in Table 1 and attributes of the data are presented in Table 2.
| Clump Thickness (CT) | Uniformity of Cell size (UC) | Uniformity of cell Shape (US) |
|---|---|---|
| Marginal Adhesion (MA) | Single Epithelial Cell Size (SE) | Bare Nuclei (BN) |
| Bland Chromatin (CB) | Normal Nucleoli (NN) | Mitoses (MI) |
| CT | UC | US | MA | SE | BN | CB | NN | MI | CLASS |
|---|---|---|---|---|---|---|---|---|---|
| 5 | 1 | 1 | 1 | 2 | 1 | 3 | 1 | 1 | B |
| 4 | 1 | 1 | 3 | 2 | 1 | 3 | 1 | 1 | B |
| 8 | 7 | 5 | 10 | 7 | 9 | 5 | 5 | 4 | M |
| 1 | 1 | 1 | 1 | 2 | 1 | 1 | 1 | 1 | B |
| 10 | 10 | 7 | 8 | 7 | 1 | 10 | 10 | 3 | M |
| 5 | 7 | 4 | 1 | 6 | 1 | 7 | 10 | 3 | M |
| 1 | 1 | 1 | 1 | 2 | 1 | 1 | 1 | 1 | B |
| 4 | 8 | 8 | 5 | 4 | 5 | 10 | 4 | 1 | M |
Systematically, this study will undergo this workflow in Figure 1 scientifically to present the results and conclusions.

Figure 1. Conceptual model.
These data records were created in Excel sheet, saved in CSV format and it was then converted to ARFF format for it to be readable by WEKA. Value for each attribute is integer ranges of 1-10 inclusive.
Experiment
In order to compare the performance of Random Forest, Random Tree, J48, Baye Net and Naïve Baye, an experiment is conducted on bench mark dataset. All experiments on the classifiers described will be conducted using libraries from Weka machine learning environment.
WEKA contains a collection of machine learning algorithms for data pre-processing, classification, regression, clustering and association rules.
Machine Learning techniques implemented in WEKA are applied to a variety of real world problems. The program offers a well-defined framework for experimenters and developers to build and evaluate their models.
Classifiers
Classifier as component of Figure 1 consists of the 5 techniques: Random Forest (Rand. F), Random Tree (Rand. T), J48 are Tree classifiers and Bayes Net (BN) and Naïve Bayes (NB) are: bayes classifier. In classifier the WBCD dataset was used in each of the classifier and 10-folds cross validation was applied on the dataset. Using 10-folds cross validation means, the dataset was broken down into ten sets. Each set represented 10% from the original dataset to allow every slice of the dataset to take a turn as a testing data.
For each round, the experiment used nine sets for training process and the reminder ones for the testing process.
In executing each of the classifier in the WEKA the running time to build the classifier in generating of confusion matrix is recorded in Table 3 and the confusion matrix for each of the classifier is presented in Table 4. Table 5 also illustrate the performance of each classifier of terms of class Table 6.
| Classifier | Time to build the model/sec. |
|---|---|
| Ran. T | 0.08 |
| Ran.F | 0.66 |
| J48 | 0.19 |
| BayesNet | 0.2 |
| Naïve Bayes | 0.11 |
| Classifier | B | M | Class |
|---|---|---|---|
| Ran. T | 442 | 16 | B |
| 14 | 227 | M | |
| Ran.F | 444 | 14 | B |
| 6 | 235 | M | |
| J48 | 438 | 20 | B |
| 18 | 223 | M | |
| BayesNet | 442 | 16 | B |
| 4 | 237 | M | |
| Naïve Bayes | 436 | 22 | B |
| 6 | 235 | M |
| Classifier | TPR | FPR | Acc. | MCR | Precision | F-Measure | MCC | ROC Area | PRC Area | Class |
|---|---|---|---|---|---|---|---|---|---|---|
| Ran. T | 0.965 | 0.058 | 0.964 | 0.036 | 0.969 | 0.967 | 0.905 | 0.956 | 0.96 | B |
| 0.942 | 0.035 | 0.942 | 0.058 | 0.934 | 0.938 | 0.905 | 0.955 | 0.907 | M | |
| Ran. F | 0.969 | 0.025 | 0.969 | 0.031 | 0.987 | 0.978 | 0.937 | 0.989 | 0.994 | B |
| 0.975 | 0.031 | 0.975 | 0.025 | 0.944 | 0.959 | 0.937 | 0.989 | 0.972 | M | |
| J48 | 0.956 | 0.075 | 0.956 | 0.044 | 0.961 | 0.958 | 0.88 | 0.955 | 0.955 | B |
| 0.925 | 0.044 | 0.967 | 0.033 | 0.918 | 0.921 | 0.88 | 0.955 | 0.902 | M | |
| Bayes Net | 0.965 | 0.017 | 0.965 | 0.035 | 0.991 | 0.978 | 0.938 | 0.992 | 0.996 | B |
| 0.983 | 0.035 | 0.983 | 0.017 | 0.937 | 0.96 | 0.938 | 0.992 | 0.982 | M | |
| Naïve | 0.952 | 0.025 | 0.952 | 0.048 | 0.986 | 0.969 | 0.914 | 0.988 | 0.995 | B |
| Bayes | 0.975 | 0.048 | 0.975 | 0.025 | 0.914 | 0.944 | 0.914 | 0.983 | 0.942 | M |
| Classifier | TPR | FPR | Acc. | MCR | Precision | F-Measure | MCC | ROC Area | PRC Area |
|---|---|---|---|---|---|---|---|---|---|
| Ran. T | 0.957 | 0.05 | 0.957 | 0.043 | 0.957 | 0.957 | 0.905 | 0.956 | 0.942 |
| Ran. F | 0.971 | 0.027 | 0.971 | 0.029 | 0.974 | 0.971 | 0.937 | 0.989 | 0.972 |
| J48 | 0.946 | 0.064 | 0.946 | 0.054 | 0.946 | 0.946 | 0.88 | 0.955 | 0.937 |
| Bayes Net | 0.971 | 0.023 | 0.971 | 0.029 | 0.972 | 0.972 | 0.938 | 0.992 | 0.991 |
| Naïve Bayes | 0.96 | 0.033 | 0.96 | 0.04 | 0.962 | 0.96 | 0.914 | 0.986 | 0.976 |
Table 7 presented the weighted average performance for each of the classifier.
| S/N | Name | Description | Formula |
|---|---|---|---|
| Eqn (1) | Precision (Prec) | Cases the classifier predicts Malignant, how often is it correct | 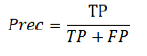 |
| Eqn (2) | Recall | Cases where it's actually Malignant, how often does the classifier predicts Malignant, however it sometime called sensitivity or True Positive Rate (TPR) | 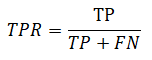 |
| Eqn (3) | F-Measure | F-measure or score is Harmonic Mean of Precision and Recall. | 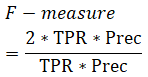 |
| Eqn (4) | MCR | Wrong made by the classifier or error rate | 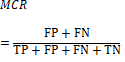 |
| Eqn (5) | Accuracy (Acc) | Correct predictions made by the classifier |  |
Figure 2 presents TPR (sensitivity) for the positive class and TNR (Specificity) for Negative class i.e. cases where it is actually malignant/benign, how often does the classifier predicts malignant/benign respectively. Bayes Net had the highest sensitivity of 98.3%and random forest highest specificity of rate 96.9%

Figure 2. True positive/negative rate for each classifier.
Figure 3 presents the accuracy of the classifier which is the correct predictions made by each classifier. Naïve Net had the highest accuracy for the positive class of 98.3%. Random forest had highest accuracy rate for the Negative class of 96.9%. Overall accuracy of the classifier was 97.1% which was attained by random forest and Naïve Bayes.

Figure 3. Accuracy of each of the classifier.
Figure 4 reports on precision i.e. cases the classifier predicts malignant, how often is it correct for the positive class. Random forest had the highest of rate 94.4%. The weighted average for a classifier random forest of rate 97.4%. For the negative class precision i.e. case the classifier predict benign how often is it correct Bayes Net had the highest rate of 99.1%. With W of rate 93.7%. Overall random forest had the highest precision of 97.4%.

Figure 4. Precision rate of each classifier.
This study presented, aimed to assess the performance of five classification of data mining algorithms in term of accuracy, sensitivity, specificity and precision. The outcome of the study concluded that random forest has the highest performance in terms of specificity (96.9%), accuracy (97.1%) and precision (97.4%). Bayes Net and Random Forest had the highest accuracy of 97.1%. Bayes Net had the highest sensitivity of 98.3%. Bayes Net and random forest took 0.2sec and 0.66sec to build the classifier respectively. Random forest took a lot of time in the learning process.
[Crossref]
[Crossref]
Journal of Health & Medical Informatics received 2700 citations as per Google Scholar report