Research Article - (2021) Volume 11, Issue 9
Received: 22-Jul-2021
Published:
30-Sep-2021
, DOI: 10.37421/2165-784X.2021.11.413
Citation: Getnet, Yordanos and Sisay Demeku. “Performance Evaluation of Water Supply Distribution System the Case of Gudo Bahir, Bahir Dar, Ethiopia” J Civil Environ Eng 11 (2021): 413.
Copyright: © 2021 Getnet Y, et al. This is an open-access article distributed under the terms of the Creative Commons Attribution License, which permits unrestricted use, distribution, and reproduction in any medium, provided the original author and source are credited.
This thesis focused on performance evaluation of water supply distribution system: case study Gudo Bahir, Bahir Dar, Ethiopia. The main objective of this study is to check the hydraulic performance of Gudo Bahir water distribution system by assessing losses of water, hydraulic performance of water distribution modeling and water supply and demand gap. Hydraulic network of the study area is simulated using Bentley Water GEMS V8i by using the data on the water distribution network of the area and master plan map of the town. The hydraulic simulation in the existing network system to satisfy the reliability of hydraulic parameters such as the pressure at a junction, head loss at each pipe material and flow of water were modeled. The water demand and supply of Gudo Bahir were not balanced. The daily water consumption of the area was 41 l/c/day used daily for different domestic activities with the billed water amount 1,619,591 m3/year was produced and 1, 087,704 m3/year was consumed and around 32.67% water was considered to be non-revenue (NRW). The level of connection in the study area was found 72.7%. The other observed big problem in Gudo Bahir area were intermittent water supply, pipe leakage, and one borehole creates a problem with the water distribution system line because it is directly joins the water distribution line without any disinfectants.
Gudo bahir • Bahir dar • Water gems V8i • Water loss • Water supply network
A water distribution system is a hydraulic infrastructure that consists of different elements like pipes, valves, pumps, tanks and reservoirs. This infrastructure helps to transfer water from the source to the consumers. Designing and operation a water distribution system is the most important consideration for a lifetime of expected loading conditions [1].
Water loss of a system is the difference between System Input Volume and Authorized Consumption. Water losses can be considered as a total volume for the whole system, or for partial systems such as raw water mains, transmission or distribution. It consist of Commercial and Physical losses (also Apparent and Real losses), the real water loss includes water lost through leakage in distribution systems, service connections, and storage tanks (including overflow) and apparent loss includes meter and record inaccuracies and unauthorized water uses such as theft or unauthorized connections [2].
Although leakage is one of the major causes for loss of water in a network distribution system, the loss of water through illegal connections and nonfunctioning meters is also contributing a lot that needs a proper management and monitoring system. While developed cities have started using on-line continuous and monitoring service, the developing cities have great problems even to collect information on their previously accomplished operation and maintenance activities that could help them developing a strategy for the future. Many developed countries use water audit procedures to determine the adequate of the system and to identify the location and magnitude of water losses [3].
Water is one of the most important natural resources, and a water scarcity is one of the world's most pressing issues. Because water is so vital to life, it is essential for the survival of all human beings, including commercial, governmental, and domestic uses to meet the growing demand for food and fiber, a power generation, the exploration, the recreation and an even animal consumption. A Climate change due to a population growth. There is a huge gap between the water supply and the demand. In developing countries like Bahir Dar, the water supply and the demand gap are increasing. The current water supply system has high drains, poor maintenance, and poor customer service and water quality problems. Gudo Bahir is found in Bahir Dar, one of the town Amhara National Regional state, is suffering from the shortage of water and high water loss. One of the common problems in Gudo Bahir water supply system was related to the water distribution system due to the topographical location of the area and one of the other problems was that the water distribution line of one of the wells was not properly laid. Thereby, there was an inadequate quantity of water supplies and low coverage in the area. Generally the reduction of water loss can partly solve water shortage in the area. Therefore, this research work was prepared to model Gudo Bahir water distribution network using WaterGEMSV8i in hydraulic performance, water loss and leakage management system.
Statement of the problem
Gudo Bahir water supply distribution system is responsible for supplying water for the town. But water supply distribution is providing inadequate services to its customers. One of the major challenges on reduction of the performance of water supply system is the demand on water increases due to the unexpected growth of population and urbanization of the town. The problem of water supply in the system is not only the problem of distribution system but also shortage of supplied water from source of water; there are instants in which water shortage is accelerated by undesirable pressure within distribution systems. There is also high amount of leakage pipeline network and pipe failure has impact on quantity of water distribution in a system(due to unmaintained maximum pressure) as well as provision of insufficient supply (due to unmaintained minimum pressure) are situations which propagate water shortage within distribution system. The main problem facing by water utilities in developing countries today is that the water demand is increasingly rapidly where supply growth is constrained by limited or scare water resources, environmental problems, other social concerns, inadequate hydraulic capacity and aging water distribution infrastructure. There is a need to establish the how Gudo Bahir water supply distribution system should perform as standard and internationally accepted key performance indicators. The analysis of customer failure statics reveal that the distribution system makes highest individual contribution to the unavailability of supply to the customers. Another basic issue currently being most of the water supply network pipeline was installed before the existing road access and residential building is constructed just only using Bahir Dar town master plan. Currently, water distribution lines are found under drainage lines, toilets, ditches, and building and in the residential building compound. Thus, this study was identify the possible technical problems with regard to hydraulic performance, water losses, evaluating the existing design operation and maintenance facility of the water supply system and nonrevenue water losses management system of the town by using WaterGEMS V8i and thereby recommend possible solutions and this study was conducted on the performance evaluation of Gudo Bahir water supply system, Bahir Dar.
General objective
The main objective of the study was to evaluation the performance of Gudo Bahir Water Supply Distribution System
Specific Objectives:
• To assess the extent of water losses in the water supply system.
• To assess the major causes of water loss in the area and evaluate the existing water supply coverage of the town.
• To evaluate the hydraulic performance of water distribution network with modeling.
Description of the study area
The research was conducted the capital of the Amhara Regional State, Bahir Dar, Gudo Bahir water supply system is located at UTM 11°35´19 ̋ N and 37°22´19 ̋ E and about 578 km North West of Addis Ababa along an asphalt road. Gudo Bahir water supply system is founded on a relatively flat area adjacent to the southern shore of Lake Tana, largest lake in Ethiopia which is the source of Blue Nile. The general elevation of the surroundings of the area is in the range of 1840meter above sea level. Towards the south and south east the land get relatively rugged as it descends to the Abbay gorge. Some scattered volcanic cones feature the surrounding area towards south west and North West. Adjacent areas are partly covered by the rough surface quaternary lava flows and partly with grass, scattered big river trees along the streams and spring sites (Figure 1).

Figure 1. Location map of the study area.
Material and tools
Depending up on the research objectives the materials were used for this study. To achieve the goal of the research the material that were used are, GPS to check the coordinate points and Pressure gauge to measure the pressure at water meters, nodes, to measure the flow of the pipe and pump outlet. Software tools have been used are, WaterGEMS V8i software to determine velocity, nodal pressure and other parameter, ArcGIS for delineation of the study area, Microsoft Excel was used for data preparation, to analyze the data obtained from the office.
Data analysis
To analyze the data which is collected from different sources, the data were analyzed and tabulated on descriptive statistical methods like percentage, graphs, and averages have been used to interpret and present. The field survey data for distribution system was evaluated by using the engineering software such as AutoCAD and WaterGemsV8i. The method of analysis was based on nodal pressure and velocity parameters. During data analysis, the nodal pressure and pipe link velocity were determined to identify higher or lower pressure zone of the area. The value which was under normal value was taken as acceptable and below and above the standard values was taken as unacceptable.
Forecasting population
Population determining strategies which are utilized for evaluating the current or future population of the area, several methods are used to forecast the population but, their result varies from one method to another. Because of the study area was fast growing area, where relatively high economic activities was observed at the same time continuous expansion of town and reliable information due to various reasons was experienced, the Central Statistical Agency population estimation strategy was chosen for the population forecasting of Gudo Bahir.
Pn = Po*ern.................................................eq.1
Where,
Pn= population at n decades or years
Po= initial population
r = Annual population growth rate
n = Design period in years
e = constant e, the base of natural logarithm
Population projection and water demand
The water demand of particular town is proportionally related to the population to be served. According to CSA (2007), the population of town was 72,582 and annual growth rate for urban population of Gudo Bahir area was 4.20% in the year of 2019. Using CSA (2007) census data as a base, the current 2019 population and the population at the end of the design period 2040 of the town was 136,897 estimated using an exponential population forecasting method. At the end of 2040, the average daily water demand, maximum daily water demand and peak hour water demand of the town were estimated 15,610.4 m3/day, 18,732.5 m3/day and 26537.5 m3/day respectively.
Average daily per capita consumption
The volume of water consumed for domestic purpose has been aggregated to all customers of the system so as to analyze the distribution of the water supply coverage to the study area. The annual consumption data has been converted to average daily per capita consumption using the number of populations. The average daily per capita consumption of each area was derived using the following expressions [3].
 ...................... .2
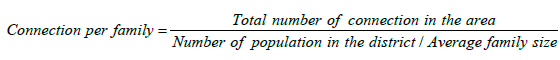
Level of connection
Access to water supply may be evaluated using the amount of water consumed and the level of connection. For evaluating the amount of water consumption, the annual water consumption is converted to average daily per capita consumption using the population data of the area. According to BDWSS billed documents the total number of connection with in the study area Figure 1. Location map of the study area. is 12,566 customers.
 ...................... .3
Unavoidable Annual Real Losses (UARL)
Unavoidable Annual Real Losses (UARL) is the accepted minimum level of physical losses from the water distribution system. The leakage from a water distribution system can never be zero [4].
Unavoidable Annual Real Losses (UARL) = (18 x Lm + 0.8 x Nc + 25 x Lp) x Pavg ……………………………………………………………… eq.4
Infrastructure Leakage Index (ILI)
Infrastructure Leakage Index (ILI) as a performance measure of network leakage. ILI is the ratio between the network Current Annual Real Losses (CARL) and Unavoidable Annual Real Losses (UARL). It is the physical losses per service connection per day can be evaluated through the analysis of one year trends in the performance indicator [5,6].
 .................................................eq.5
Water loss analysis
The average per-capital consumption and level of water connection was evaluated and then the total water loss was analyses. In order to analysis of water loss all the required data collection was carried out such as water production and water consumption data. To analyze the water loss the following formula were conducted [4].
Water losses = System Input Volume – Authorized Consumption............................................... eq.6
Water supply coverage analysis
According to the Bahir Dar town water supply service office report the water supply coverage of the town has been evaluated based on the average per capita consumption. The average per capita consumption has been derived from the yearly Consumption that was collected from someone domestic water meters. There are a total number of 12,566 customers including residential, commercial and governmental.
Water production and consumption
The water production rate of Gudo Bahir water supply distribution system has increased from 1,534,612 m3 in the year of 2017 to 1,619,591 m3 in the year of 2019. And the water consumption rate also increased from 1,035,404 m3 in the year of 2017 to 1,087,704 m3 in the year of 2019. Based on the analysis results the total water production from the system is 1,619,591 m3/ year of the system and total water consumption is 1,087,704 m3/year and Nonrevenue water is 32.67% views in the year of 2019. As explains in the Table 1 an average of 32.16% of water loss has been undertaken. According to saroj [7] >25% water loss there is insufficient water in the study area due to high water loss and reduction needed (Figure 2).
| Year | Water Production (m3) | Water Consumption (m3) | Water Loss (m3) | Water Loss (%) |
|---|---|---|---|---|
| 2017 | 15,34,612 | 10,35,404 | 4,99,280 | 32.45 |
| 2018 | 15,44,761 | 10,64,460 | 4,80,310 | 30.99 |
| 2019 | 16,19,591 | 10,87,704 | 5,31,887 | 32.67 |
| Average | 15,66,321 | 10,62,523 | 5,03,826 | 32.16 |

Figure 2. 2019 monthly water distribution curve.
Cause of water loss
There are several reasons for high level of water loss in Gudo Bahir. These factors are Leakage from the distribution mains may occur at pipelines, valves and joints was the major cause of water loss in the area, where water losses in water distribution system such as high pressure, corrosion, poorly designed and constructed of distribution system and data handling error (Figure 3).

Figure 3. Yearly water production, consumption and loss trend.
Water demand estimation
Water demand estimation is source of water supply and to fill water supply and demand gap between water production and demand consumption. The existing water supply to Gudo Bahir water supply systems was 4437.236 m3/ day and the per capita demand that had been adopted as 80l/c/d. this water is supplying in the study area at both 24hrs and 16hrs at lower and higher elevation area respectively. Hence the total demand including the UFW in the system is 5034.73 m3/day for supplying water 24 hrs. To fill the gap additional 597.494 m3/day amount of water is required to fulfill the supply shortage and demand the Gudo Bahir water supply system.
The supply and demand gap between production and demand consumption is = Supply – Demand =(4437.236 m3/day – 5034.73 m3/day)= -597.494 m3/ day. Negative sign indicates that additional water quantity required in the system per day to meet the subsystem supply and demand gaps.
Model results
The study area representative sample measurements were taken from the whole water distribution system. So 6 nodes have been observed for calibration and validation process. In this study, the pressure data measured from the system to the node home faucet are used to evaluate the performance of the model. The model performance measure Such as the coefficient of determination (R2) and the degree of accuracy (error of difference) are two techniques to be considered for the calibration model.
Calibration
Calibration is the process of comparing the analysis results to field observations and, if necessary, adjusting the data describing the system until system predicted performance reasonably agrees with measured system performance over a wide range of operating conditions. Pressures were measured in the field in order to compare with the simulated of the distribution model. The measurements were covered the low, medium and high-pressure areas of the distribution network of the area. The following figure expressing the variation of the simulated and observed pressure at the sample nodes (Figure 4).

Figure 4. Variation of observed and simulated pressure at sample junctions.
Validation
Model validation is the steps that follows calibration and uses an independent field data set to verify that the model is well calibrated. In the validation step, the calibrated model is run under conditions differing from those used for calibration and the results compared to field data. If the model results closely approximate the field results (visually) for an appropriate time period, the calibrated model is considered to be validated.
From the above Figure 5, the coefficient of determination (R2) value for peak demand and low demand time was 0.993. Since the value of R2 approaches to 1, that indicates there is a good correlation between fields measured pressure and simulated pressure.

Figure 5. Correlation between observed and simulated pressure relationship plot.
Pressure
The minimum and maximum operating pressure in the water supply distribution system network in Ethiopia was 15 m and 70 m respectively (MOWR, 2006) [8]. Pressure influences the water supply capacity of the distribution system. In order to achieve a 15 m minimum and 70 m maximum operating pressure, it is necessary to provide pressure controlling valve establishing boosting station and replacing the old pipe with the new one. According those consumers further away from supply points was always collect less water than those nearer to the source due to pressure losses in the network is increasing as far from the source. Pressure was decrease as elevation increase and vice versa (Figure 6).

Figure 6. Pressure relationship plot at peak hour consumption.
The WDN of Gudo Bahir was classified using a contour browser, which area is high, medium, and small-pressure parts. With concerning current simulation, the result for pressure using the estimated average daily demand during peak hour consumption is summarized in Table 1.
As described in Table 2, 1.3% below recommended pressure, 0.7% above the recommended pressure and 98% of junctions are within the recommended pressure ranges of minimum 15 m and maximum 70 m pressure. Lower pressure can cause reduction of quantities of water supplied to the consumer and entry of a contaminant or self-deterioration of water quality within the network itself a severe damage to public health.
| Pressure Range | Pipe Number | Coverage (%) |
|---|---|---|
| <=15 | 4 | 1.3 |
| >70 | 2 | 0.7 |
| 15-70 | 294 | 98 |
| Total | 300 | 100 |
Velocity
Velocity of water flow in a pipe is also one of the important parameters in hydraulic modeling performance evaluation of the efficiency of water supply distribution and transmission line. Velocity distribution is also varying with demand pattern changes. There are specific standards for velocity. The result of velocity of Gudo Bahir is not desirable or adequate with response to urban water supply design criteria. These types of hydraulic indicators are as if a pressure unfortunate as the result of the strategy description. At the peak hour demand the values are different as compare to minimum consumption hour. The water supply system network velocity during peak hour demand is summarized in the Table 3 below.
| Velocity (m/s) | Pipe Number | Coverage (%) |
|---|---|---|
| <0.6 | 278 | 82.25 |
| 0.6-2 | 60 | 17.75 |
| Total | 338 | 100 |
The velocity of water flow in a pipe is also one of the important parameters to evaluate hydraulic performance of a water supply distribution system. The velocity of flow in the pipe below 0.6 m/s causes‟ water stagnation and bacteriological growth in the pipe, on the other hand velocity of flow in the pipe above 2 m/s causes a water hammer problem. Velocity in water distribution system was varied with the demand pattern change.
Therefore control of the flow velocity in water distribution networks should be maintained in order to avoid pipe break, water hammer, water stagnation which causes sediment deposition in the pipe and head loss. The result of the analysis showed that the overall technical performance of existing water distribution of the town was poor which is reflected by low water production rate, low water consumption, and high level of non-revenue water, low service coverage, not velocity and pressure in permissible range (Figure 7).

Figure 7. Velocity relationship plot at peak hour consumption.
The total water loss in the water supply system in the year of 2019 was found 53,887 m3/year and 32.67%. The average per capital consumption of Gudo Bahir water supply system was found 41 l/person/day.
In this study, the existing WDS is simulated through the construct of a model using Bentley Water GEMS V8i. The actual system was evaluated for the existing design, operation, and maintenance of the network, especially in various abnormal situations. The result evaluated the design, operation and maintenance facilities were poor due to the wrong model result implementation without modifying and due to the poor technician.
Lack or shortage of Professional experts regarding maintenance, record keeping, service deliveries are significant gaps observed. And also less attention towards water loss management are the major problems of Gudo Bahir water supply system, Bahir Dar.
Pressure Reducing Valve (PRV) is used in the boreholes to overcoming the problem of high pressure effects.
• The borehole number 1 (Gudo Bahir-1) is directly distributed to the customer without any disinfectant so the water is not good for health therefore the Bahir Dar water supply office must take care over it.
• In general, all relevant document, feasibility studies, borehole history and detail design as built drawing of all existing water supply system components for the source, reservoirs need to be documented in a well-organized way and should be available in water utility office for future reference is strongly recommended.
• The system of water supply system needs detail study before distribution pipe expansion.
• Leakage detector instruments (Geophones, Sounding bar) must be full filled to identify the main causes of water loss that means leakage.
• SCADA computer system should be installed at well field and the reservoir. Supervisory control and data acquisition is essentially a distributed computer system that is used by operations and management for process monitoring entire distribution network. The communication network is spread throughout the water distribution network.
Journal of Civil and Environmental Engineering received 1798 citations as per Google Scholar report


