Review Article - (2020) Volume 4, Issue 1
Received: 28-Feb-2020
Published:
20-Mar-2020
, DOI: 10.37421/vcrh.2020.4.111
Citation: Wickramasinghe NC, Steele EJ,
Gorczynski RM, Temple R, Tokoro G et al. "Predicting the future Trajectory of Trajectory of COVID-19". Virol Curr Res 4 (2020) doi: 10.37421/Virol Curr Res.2020.4.11
Copyright: © 2020 Wickramasinghe NC, et al. This is an open-access article distributed under the terms of the creative commons attribution license which permits
unrestricted use, distribution and reproduction in any medium, provided the original author and source are credited.
We argue that the new coronavirus COVID-19 was probably linked to the arrival of a pure culture of the virus in cometary debris that was deposited in the stratosphere, and first came down in the Hubei province of China. The subsequent worldwide spread of the virus has taken place by a combination of two effects: the deposition of further large quantities of virus at several locations – Iran, North Italy, South Korea – combined with much slower spread through person-to-person infection (itself enhanced largely by contaminated surfaces and personal affects). The location of the foci outside China all lie close to latitude 40 degrees N, consistent with the transport of aerosols by cyclonic winds in the stratosphere. It is also remarkably consistent with observations in the 1960’s of the fall-out of radioactive dust deposited in the stratosphere in the last of the atmospheric atom bomb tests. On this basis, we conclude that a stratospheric loading of the Coronavirus that happened in October/ November 2019 could take a few winter seasons to be fully drained. A clearer understanding of the causal events that led to the COVID-19 pandemic could help planning future strategy.
Coronavirus • Epidemiology • Comets • Panspermia
In our earlier papers [1,2] we have discussed the possibility that the onset of the 2019-COVID-19 pandemic in Wuhan in China was triggered by the in-fall of a cloud of virus-laden dust deposited by a cometary bolide. We suggested that the cometary bolide may have been linked to a spectacular fireball event that was witnessed in the province of Jilin on 11 October 2019. The proposal to rename COVID-19 to SARS-CoV-2 could fortuitously fit in with the case for space origin of both SARS-CoV-1 AND SARS-CoV-2. The first cases of SARS-CoV-1 recorded in November 2002 actually appeared a few weeks after a bright cometary meteoroid exploded in the Ikutsk region of Siberia [2]. This suggesting that the SARS-virus-dust may have been deposited as a dispersed fragment of the same bolide in the stratosphere and subsequently carried by air currents to fall first over China. The events of 2002 bear an uncanny resemblance to the events that followed the sighting of the Jilin fireball in October 2019 [1].
Both bolides of 2002 and 2019 most probably belonged to the Orionid meteor stream which is associated with the historic Comet P/ Halley. Comet P/Halley in pursuing its orbit around the sun ejects fragments of all sizes from dust to bolides that eventually separate from the parent body and pursue similar highly elliptic orbits with a period of 76 years. The last perihelion passage was in 1986 and at this time the Giotto space mission combined with ground-based telescope observations began a new era of cometary studies. Halley’s comet itself is about 10 km in diameter and the material ejected from its pitch-black surface in 1986 was found to have an infrared spectrum consistent with biological dust [3].The stream of dust and debris of all sizes ejected throughout the entire life of Comet Halley continues to orbit within a broad stream constituting the Orionid meteor stream. The Earth crosses this stream of debris every year in late October/early November. The events in Ikutsk and Jilin, which are exactly 17 years apart, could represent encounters of the Earth with two large frozen lumps that had broken off from the comet which contained clonal variants of the Corona virus [4].
The unfolding global pandemic of COVID-19 as time proceeds becomes increasingly difficult to unravel given both a possible continuing in-fall of the now-dispersed virus-laden dust cloud fragments combined with a slow contagion or person to person spread (itself contributed largely derived, in our view, from contaminated surfaces and personal affects [5]. The various measures being taken to “contain” or “delay” the progress of this pandemic, although taken in good faith, fall short of planning for resurgences caused by a continuing sequence of further in-fall episodes of this viral-dust.
Some of the following main facts appear to be undeniable, yet some need a critical reappraisal:
(a) An initial “in-fall” of trillions of virions in bolide dust particles (acting as protective matrices) from outside the human population took place leading to a huge number of COVID-19 cases in the region of incidence (Hubei) and its environs, particularly Wuhan city. Our informed view is that many people were almost simultaneously infected and naturally inoculated with the same COVID-19 virus strain. This happened in a matter of days after the first cases were recorded in early November 2019 [1,6].
(b) The claim that the virus was transferred to humans from bats through an intermediary animal has been widely claimed, but there is no direct supporting evidence for such a hypothesis, and it is not generally supported by the phylogenetic analyses. These analyses themselves rest on the false premise of circular logic – the evolutionary model [7] at their heart actually assumes a progression of viral evolution through two animal species then to human as its first unwavering principle. It is also based on highly questionable analyses of gene sequence data involving two intermediate, and unlikely, animal jumps, first from bats to an intermediary animal “ X ” (= pangolins) then to humans who acquire infection from eating that animal (Steele EJ and colleagues In preparation). For example in Tang et al. [7] the two linked single nucleotide substitutions (the basis of the two circulating haplotypes, L and S) appear at APOBEC and ADAR deaminase motif sites that appear to be hotspots for C-to-U and A-to-I deaminations and thus are part of the expected quasi viral sequence species pool in vivo during the early acute phase of infection i.e. part and parcel of natural viral “evolution” in vivo [8]. The claim that the minor S variant evolved in two steps in animals (bats -> pangolins?) and then mutated at these sites to produce the major L haplotypes, thus producing both the SARS-CoV-1 and SARS-CoV-2 variants, is pure conjecture with no hard evidence Tang et al. [7]. It could equally be that on in-fall in 2002 by SARS-CoV-1 the naturally occurring or in vivo generated S variant thrived best in the animals studied, while the L variant was best suited for human replication. The fact that the second of the two linked SNV variants is a T>C at a clear ADAR deamination motif site (..GTTTACCTTT..) in the 5’UTR, a region known for regulating viral replication [9], implies that replication rates could be controlled at a alternative secondary RNA structure ( “ riboswitch ” ) by T>C (ADAR) and/or C>T (APOBEC) deaminations at this site. None of this biological insight is evident in the Tang et al. [7] analysis nor in any other coronavirus phylogenetic analyses we have seen recently.
(c) A worldwide spread solely from an initial case or cluster of cases in Wuhan is generally claimed but evidence for this is still lacking. A simultaneous or near simultaneous attack of thousands of people from an external source/reservoir appears in our view a more likely explanation for the available data.
(d) Transmissions (contagion) must certainly have contributed to spread within Wuhan and surroundings, but transmissions outwards from Wuhan across the wider world based on contagion alone proceeds at a much slower rate depending on movement of infected persons and would in general be overwhelmed by secondary infall events.
We have discussed earlier [1,2] the many unsuccessful searches for a case zero that may have triggered secondary foci of infection that exploded several months after the original outbreak in Wuhan. Tracing index cases has been a frustratingly difficult endeavour, and an alternative model of independent origins or secondary in-fall events from the stratosphere, characterised by high attack rates, is strongly suggested as an alternate explanation of the epidemiological data. This appears to be relevant to the cases in Iran and Italy where an almost uncanny simultaneous exponential initial rise in case numbers is to be seen at clear epicentres (Figure 1) at highly specific locations in the country (Lombardy in Italy; Tehran-Qom in Iran), in the analogous fashion to the specific epicentre location at Wuhan in China (Figure 2).
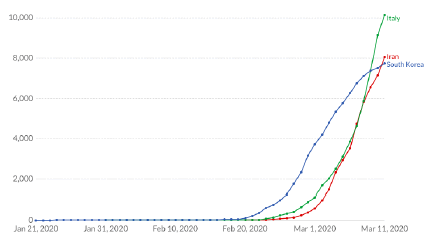
Figure 1: Total cases of COVID-19 to March 11, 2020 from data in [10].
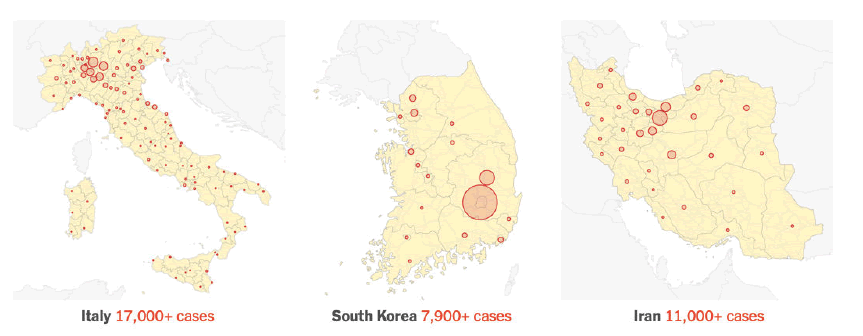
Figure 2: Gross inequalities of the attack rates Italy, Iran and South Korea.
The slower spread out from an initial focus of in-fall is clearly evident from the diminishing attack rates seen in Figure 2 outside of the Lombardy valley which suddenly acquired thousands of cases, and similarly in the case of foci in South Korea and Iran.
These are from New York Times 12 March 2020 [11].
Similar patterns were seen outside the other main foci world-wide until contagion began to even out the numbers to some extent. In this connection, we should stress that the case numbers thus far recorded everywhere, although large enough to cause concern, are certainly underestimates of case incidence. Considering the manner in which the samples are chosen the total numbers of seropositive COVID-19 cases may be higher everywhere by factors in excess of 10 or 100. We await the COVID-19 serology data, or presence/ absence of COVID-19 specific antibodies, with great interest Figure 3 [3].
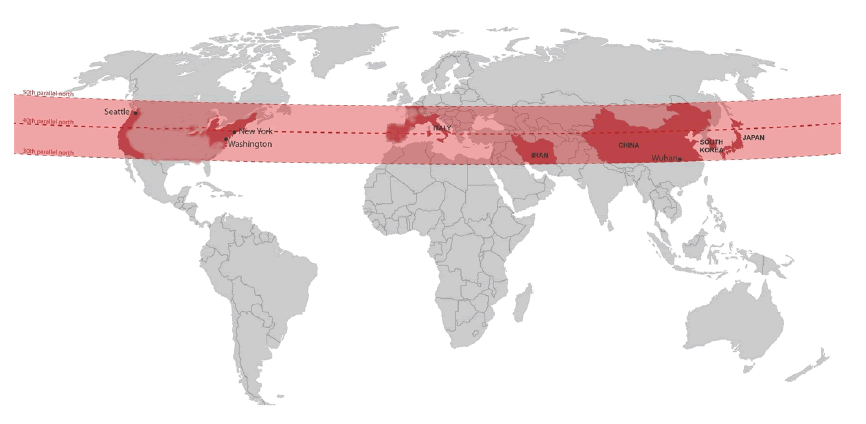
Figure 3: Chain of foci of COVID-19 straddling latitude belt 30-50 degrees N (prepared by Alexander Kondakov, assisted by Chandra Wickramasinghe).
Perhaps the most remarkable feature of the foci of infection outside China is that they are all located close to latitude 30-50 degrees N. These foci seem to have developed more or less in sequence moving westward from in China, South Korea, Iran and the Lombardy valley of Italy in mid-February 2020, and thence to North America along more or less the same belt of latitude. The times of descent to ground from such a belt of dispersed material depends, however, on local tropospheric weather conditions, and the early outbreaks in the west coast of the USA could be explained as the result of dust clouds carried by winds moving in an easterly direction from Wuhan [1]. It should be noted that the same general belt of latitude (30-50 degrees N) is implicated in many seasonal respiratory diseases including seasonal influenza and respiratory syncitial virus, RSV. The incidence of the latter is shown in Figure 4.
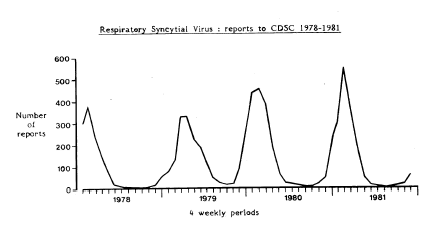
Figure 4: Incidence of RSV- virus in the UK from 1977-1982. (Data from Communicable Disease Surveillance Centre, UK).
This could be interpreted as evidence of a seasonal in-fall pattern over the same latitude belt of a common virus that may well be constantly resupplied from the stratosphere. Considering that the daily fall-out from the atmosphere of viruses above the atmospheric boundary layer has been measured at billions of viruses per square metre per day, this would not be a surprise [12].
The defining feature of infectious diseases which are caused by biological entities (bacteria and viruses) that arrive from space relates to the manner in which they come to be distributed over the Earth’s surface. If such microbial agents are introduced via the agency of cometary bolides (e.g. fragments of the Jilin meteor) that survive frictional heating in the mesosphere, their fragmentation first as smaller bolides and then as dispersed clouds of particles in the stratosphere will determine the way in which they finally arrive at the surface of the Earth.
The falling speed of spherical particles of various sizes (with a notional density 1 g cm-3) through the atmosphere can be calculated as a function of height (y-axis) and was calculated from formulae and data given by Kasten [13]. The results are shown in Figure 5. We note from the extreme right curve of Figure 5 that a particle of radius 10 μm falls through the lowest 10 km of the stratosphere at a speed of ~ 1 cm/s and so takes only a few days to cover what, for smaller particles, is the slowest part of their downward journey. All such particles fall comparatively rapidly through the mesosphere (z = 80-50 km), and then more and more slowly down through the stratosphere below z=50 km. A particle with the size of a ~ 3 μm appropriate for a clump of viruses, falls through the lowest ten kilometers of the stratosphere at a speed of about 2 × 10⁻¹ cm s-1 and thus falls to ground in a time-scale of ~ 5 × 10⁷ sec, that is about 2 months – consistent with the delay time between sighting of the Jilin meteor and the first cases in Wuhan.
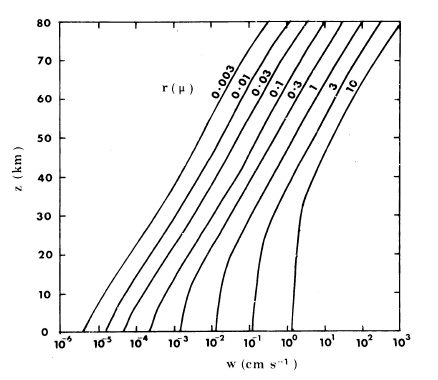
Figure 5: Falling speed of spherical dust particles as a function of height in the atmosphere (reproduced from Hoyle and Wickramasinghe [14], Proofs that Life is Cosmic, Mem. Inst.Fund.Studies, Sri Lanka, 1982) (copyright Chandra Wickramasinghe).
Ozone measurements can be used to trace the mass movements of air in the stratosphere and such movements could carry clusters of viral particles. Such measurements have consistently shown a winter downdraft that is strongest over the latitude range 40-60 degrees. Taking advantage of this annual downdraft, individual virus particles (or significant dust encased in 10 micrometre sized clumps) incident on the atmosphere from space would therefore reach ground-level generally in temperate latitudes. These latitudes therefore emerge as the location where upper respiratory infections would be predicted to be most prevalent.
A direct proof that the winter downdraft effect in the stratosphere occurs overwhelmingly over the latitude range 40-60 degrees was given by Kalkstein [15]. In the last of the series of nuclear bombs that were tested in the atmosphere, a radioactive tracer element Rh-102 was introduced into the atmosphere at a height above 100 km and the fall out of the tracer was measured year by year through airplane and balloon sampling at altitudes of ~ 20 km. The tracer took more than a decade to clear itself through repeated seasonal downdrafts of the kind we have described. This is shown in Figure 6 where we should note that the y-axis is on a logarithmic scale. Here the fall out of the radioactive tracer Rh-102 can be seen to be much greater at temperate latitudes than elsewhere, with the period January to March being the dominant months for the Northern Hemisphere. In correlating this data with the COVID-19 pandemic we might predict that the in-fall in temperate latitudes may wane after April. However, if smaller clumps of viruses still remain in the stratosphere, the repeated flushing occurring seasonally over the winter months could nevertheless lead to persistent risk for a few years to come. Offsetting this ongoing risk is that following a first wave of pathogen exposure, herd immunity is predicted to develop, with subsequent incursions of the virus representing no more a challenge than season influenza or the RSV virus.
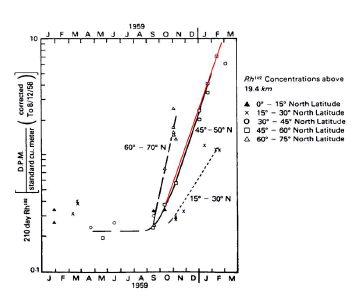
Figure 6: The fall out of Rh-102 at various latitude intervals from the HARDACK atmospheric nuclear bomb test exploded on 11 August 1958 (Kalskstein, 1962; Ref 15) (reproduced from Hoyle & Wickramasinghe: Proofs that Life is Cosmic, 1982; Ref 14).
The distinct seasonality of respiratory viruses, including influenza and the common cold, which more or less disappear with the advent of Spring, is traditionally attributed (without proof) to warm weather, ultraviolet light acting as a sterilizer, and to changing social behaviour. Much more likely, in our view, is that a primary source of the virus from the troposphere declines in late spring due to well attested atmospheric circulation patterns. A reservoir of viruses deposited in the troposphere will thus have a cyclical seasonal turn over – coming down more vigorously in the winter months. Likewise, a new virus deposited in the stratosphere over the northern temperate latitude belt shown in Figure 3 will be largely confined Northern latitudes until it diffuses to the southern hemisphere and is thereafter deposited to the ground 6 months later.
If our model is valid the epidemic behaviour of COVID-19 from January to March in the Northern and Southern hemispheres should be dramatically different. Cases of COVID-19 in the southern hemisphere (e.g. Australia) during the months January-March would be more or less exclusively determined by the movement of infected people from foci of disease in the Northern hemisphere. Precisely this type of difference between the two categories is clearly to be seen in Figures 7 and 8 compiled by Macintyre [16].
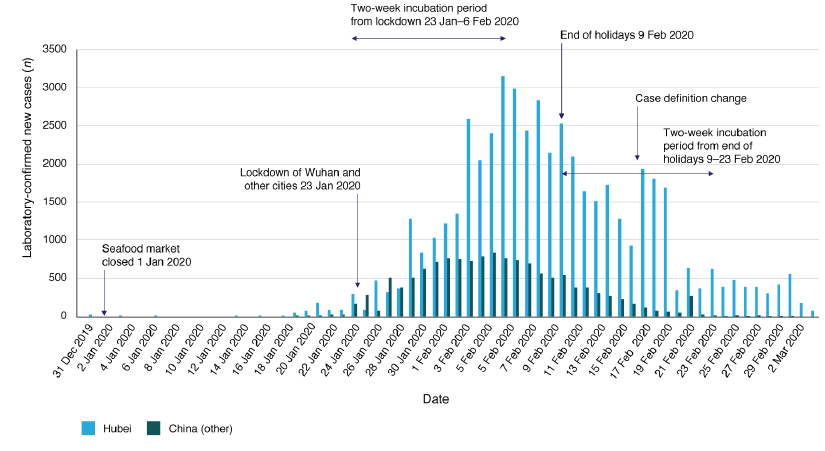
Figure 7: Epidemic in China – exponential rise, peak and decline.
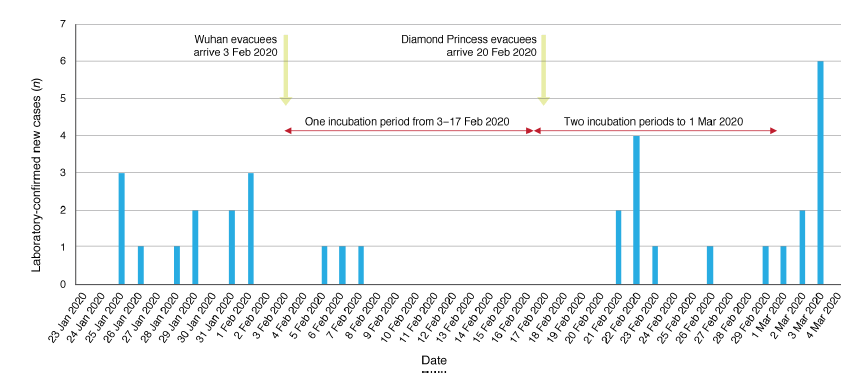
Figure 8: Australian cases of COVID19 – slow spread from random injections of infected people and goods during the period January – March 2020 [15].
With the draconian measures including restrictions of travel and social gatherings that are being put in force in several countries, and hospital resources stretched to full capacity, the most positive outcome to anticipate is the eventual development of natural herd immunity. This has acted as a major driver of rapid declines in similar emerging diseases like SARS and MERS. A decline attributable to the production and clinical introduction of an effective vaccine, given past experience, is likely some 12-18 months away. In the longer term, it seems to us imperative that we should explore methods for predicting such events ahead of their occurrence with a view to making appropriate plans for alleviating disaster. We have already suggested a few general criteria that could be looked for – e.g. the phase of the sunspot cycle and cosmic ray flux [17-19]. More important, however, is to recognise the emerging irrefutable fact that the Earth is not an isolated biological system and that bacteria and viruses may be arriving more or less steadily from a wider cosmic biosphere. Some 800 million viruses per square metre per day that have recently been estimated to be falling through the atmospheric boundary layer from altitudes of 4 km in the Sierra Nevada Mountains [12]. Most, though not all of this flux can be attributed to a terrestrial origin and recycling of uplifted material, but a significant number are not accounted for. Furthermore, collections of stratospheric material over the past decade have consistently revealed the presence of bacteria, including new bacterial species, at height of 41 km [20-22] and the presence of bacteria on the exterior of the International Space Station at 400 km has also been reported [23].
These developments give added credence to microbiota of external origin arriving steadily at the Earth. Because the descent through the atmosphere of viral and bacterial-sized particles from heights above 40 km could take several months the desirability of monitoring the stratosphere is amply clear. Aircraft, balloons and rockets could be deployed for this purpose along with next generation gene sampling technologies to give us advanced warning of future pandemic-causing pathogens before they fall to Earth. Not to do so is an abrogation of our duty as members of the species Homo sapiens sapiens in the year 2020.
Virology: Current Research received 187 citations as per Google Scholar report