Research Article - (2024) Volume 15, Issue 1
Received: 20-Jun-2023, Manuscript No. JAR-23-103381;
Editor assigned: 23-Jun-2023, Pre QC No. JAR-23-103381 (PQ);
Reviewed: 10-Jul-2023, QC No. JAR-23-103381;
Revised: 27-Dec-2023, Manuscript No. JAR-23-103381 (R);
Published:
03-Jan-2024
, DOI: 10.37421/2155-6113.2024.15.968
Citation: Gebrerufael, Gebru Gebremeskel and Zeytu
Gashaw Asfaw. "Predictors of Joint Modeling on Time to Mortality
Progression with CD4 Cell Progression and Its Association with HIV/AIDS
Patients Receiving ART in Mekelle General Hospital, Northern Ethiopia: A
Retrospective Cohort Study." J AIDS Clin Res 15 (2024): 968.
Copyright: © 2024 Gebrerufael GG, et al. This is an open-access article distributed under the terms of the creative commons attribution license which permits
unrestricted use, distribution and reproduction in any medium, provided the original author and source are credited.
Background of the study: The Acquired Immune Deficiency Syndrome (AIDS), which has caused the world's worst heartbreak and danger, is caused by the Human Immunodeficiency Virus (HIV), which is a virus. The purpose of this inquiry was to pinpoint the key joint predictor factors and their relationships, two of which were the progression of CD4 cells and the time to death for HIV/AIDS patients starting ART at Mekelle General Hospital (MGH) in Northern Ethiopia.
Methods: A longitudinal retrospective cohort follow-up study involving 216 HIV positive individuals was used to look into the progression of CD4 cells and the time to mortality in these patients. The primary joint predictor variables and their association with time-to-mortality for HIV/AIDS patients who started ART were found using a joint model analysis approach. In the general hospital's records, 216 HIV positive patients were selected systematically at random. The JM package and R 3.6.1 version procedure were used to examine the secondary data.
Results: The findings showed that there was a statistically significant negative relationship between the two response variables, CD4 cell count progression and time to mortality (α=-9.4; and p<0.0001*). Being co-infected with (β=-0.125; and p<0.001*), as well as the follow-up visit duration (β=-0.005 and p<0.001*), had a statistically significant impact on the likelihood that the CD4 cells count would increase. Additionally, patients who were WHO stage-III or IV (AHR=1.7; and p<0.0384*), or co-infected with TB (AHR=3.63; and p<0.002*) had statistically been linked to a higher risk of mortality.
Conclusion: In order to simultaneously study the important effects of predictor factors on the change in CD4 cell count progression and the risk of patient mortality, the authors used that statistical joint model, which provides a flexible framework. The association parameter change of CD4 cell progression on the chances of mortality events was also evaluated by this combined model analysis.
Time-to-mortality • HIV/AIDS • CD4 cells progression • Joint modeling • CD4 cells
The Acquired Immune Deficiency Syndrome (AIDS), which has caused the worst suffering and danger all over the world, is caused by the Human Immunodeficiency Virus (HIV). The human immunodeficiency virus affects and causes damage to various types of white blood cells, which are crucial to the body's ability to coordinate its defenses and its genetic potential to fend against disease contamination [1,2]. Currently, there are around 37.9 million people living with HIV worldwide, with Sub-Saharan Africa accounting for the majority of patients (71%), including those from other countries [3].
In Ethiopia, there are now 722,248 people living with HIV. As a result, 23,000 people are now HIV positive, and 11,000 people have passed away from an AIDS-related infection [4]. Out of the total number of HIV positive individuals still living, 81% were taking their medications regularly, 73% had viral suppression, and 79% knew their status [5].
Over 71,000 people had started receiving free antiretrieval therapy in Ethiopia as of the end of November 2006. Currently, 241 general hospitals and healthcare facilities around the nation offer HIV prevention and treatment services. According to a study [6], keeping track of CD4 cell counts is useful for initiating and monitoring medication in HIV positive patients receiving efficient anti-retrieval therapy. However, there are other important factors besides HIV. These indicators may influence the progression of CD4 cells. Sex, TB co-infection, and WHO clinical stage-III or IV is among the factors that influence the CD4 count response to ART [7,8].
Researchers have studied factors that affect CD4 cell alterations and the longevity of HIV-infected cohort studies in Ethiopia, where the prevalence of HIV/AIDS is highest. While employing flexible advanced methodologies such as joint models, the detailed researchers did not take into account the predictors of joint CD4 cell progression with time-to-mortality and their correlations between the two outcomes of HIV positive patients under antiretrieval medication. Additionally, the earlier displays of individuals using the methodologies described in the current study for the two outcome variables are incorrect.
Therefore, the purpose of this inquiry was to pinpoint the key joint predictor factors and their relationships, two of which were the progression of CD4 cells and the time to death for HIV/AIDS patients who started ART at MGH in Northern Ethiopia. The efficiency of the parameter estimations could be obtained using this joint analysis approach, which was advantageous. Thus, the development of such a model has received methodological and practical support from health professionals and is utilized as a guide for future studies that indicate the theoretical foundation of the model.
Study design and period
This retrospective cohort longitudinal study, which ran from September 1, 2014, to September 30, 2016, was conducted.
Study area, population, and sampling procedures
The investigation was conducted in Northern Ethiopia, Tigray regional state, and Mekelle General Hospital (MGH). In the general hospital, there were 1021 HIV positive patients receiving ART, and 865 (84.7%) of them had completed the recorded variables chart for the ART follow-up. In a recent study design, systematic random sampling methods were used for 216 out of 865 HIV positive patients. All HIV positive patients who attended the ART unit throughout the time of data collection and met the eligibility requirements were included in the study population.
Eligibility criteria
All HIV positive patients who have been identified and are receiving ART were included in this study; those beginning followup ART. Patients who were transferred out of the study, as were had variable registrations that were incomplete, or were under 15 years old were omitted.
Data collection procedures
Using the R 3.6.1 software version and the JM package, secondary raw data were loaded into Excel and coded before being used to analyze the model. In the current study's design, CD4 cells/ mm3 measurements could be made at least once following the start of their ART for the outcome variable.
Quality of data
This investigation was conducted in collaboration with data quality managers at the general hospital's anti-retrieval virus division. The data gatherers underwent focused training.
Study variables
Time-to-mortality, which was separated into censored response variables that measured time in months and mortality (event), was the major response variable for survival. The phrase "there was right censored" relates to being alive and lost (drop-up). The main goals of this reaction centered on the HIV/AIDS patients' survival rates, which were being regarded as event times as they passed away.
The progression of CD4 cells, which is assessed in cells/mm3 at least measured ones after commencing ART, was the second response variable in the current investigation.
Over the course of about six months, patients' CD4 cell levels were frequently tracked. The study's covariate variables included gender (male, female), marital status (single, married, separated), WHO clinical stage (I/II, III/IV), co-tuberculosis infection (yes, no), educational level (illiterate or elementary, secondary or tertiary), functional status (working, ambulatory, or bedridden), and follow-up visit frequency.
Longitudinal and survival statistical separate model analysis
Cox proportional hazard model: The Cox Proportional Hazard (PH) model is one of the most commonly used types of regression models used in survival analysis [9].
Cox PH model,

Were used to determine and check the effect of each covariate variable on time-to-mortality events. The hazard function h(t) is identified by a set of p covariates (x1,x2,x3,……,xp), whose effect is measured by the magnitude of the corresponding coefficients (b1, b2,b3,……,bp). The term h0 (t) is called the baseline hazard for a survival time-to-mortality. The proportionality assumptions of the Cox model were examined for each predictor individually as well as across the board. None of the Cox PH model assumptions for the predictor variables were violated.
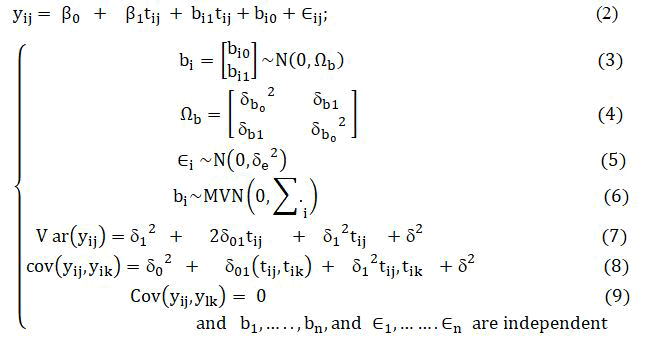
Linear mixed model: When examining longitudinal normally distributed data for continuous responses, linear mixed models are frequently used. There are two causes of variance that have been measured for any longitudinal data. These are the variances within each patient that rise throughout measurements and the variations between patients that rise during measurements between various patients. While statistical modeling of patient variations helps us understand variation across time, modeling of patient differences helps us understand differences between patients. In order to analyze these two degrees of variability, this approach was used to explore how patients' CD4 cell progression data changed over time. As a result, the change in CD4 cell count at each patient's was evaluated for both within and between-patient variability I=1, 2. . . n. The following random effect model analysis techniques were used to analyze this linear mixed model [10,11].
Random intercept and slope model: The most realistic kind of model is probably one with both Random Intercepts and Random Slopes (RI-RS), but it is also the most difficult to construct. Since both intercepts and slopes are allowed to vary between patient groups in this model, they can be different depending on the situation.
The following are the details of the random intercept and slopes of the linear mixed model:
Joint statistical model analysis
The survival sub-model: The goal of this study is to quantify the strength of the correlation between the risk of survival time to mortality and the longitudinal marker of CD4 cell progression. To accomplish this study, we present the term mi (t) that represents the true and unobserved value of the longitudinal CD4 cell count outcome at time t. Remember that mi (t) is different from yi (t), with the last being the contaminated measurement of the error value of the longitudinal outcome at time t. To measure the strong point of the association between mi (t) and the hazard for a time-to-event, a straightforward approach is to postulate a relative risk model of the form:

Where, Mi (t)={mi(t), 0 ≤ s<t} represents the history of the true unobserved longitudinal CD4 cell process up to time point t, h0 (.) denotes the baseline risk function, and wi is a vector of baseline covariates (such as a treatment indicator, history of diseases, etc.) with a corresponding vector of regression coefficients γ.
The longitudinal sub-model: For continuous repeated observations of CD4 cell progression; this longitudinal sub-model incorporates a proportional longitudinal model with subject-specific random effects.
Longitudinal information is really collected intermittently and with error at a set of a few period points tij for each individual patient. Therefore, we need to estimate mi (t) and successfully rebuild the entire longitudinal history Mi (t) for each patient in order to quantify the effect on the longitudinal covariate variable with the hazard for an event (time-to-mortality). In order to complete the current investigation, we postulate a suitable linear mixed effects model to specify the subject-specific period progression with an emphasis on longitudinal outcomes that are normally distributed.
In particular, we can define as follow below formula.
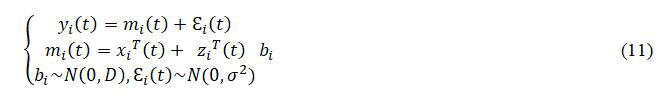
Where, we explicitly note that the design vectors xi (t) for the fixed effects β, and z(t) for the random effects bi, as well as the error terms εi(t), are time dependent.
Procedures for choosing and comparing models
It is crucial to compare the separate model analysis approach with the joint model analysis approach by using various kinds of procedures and methods. In this study, the authors selected the best model that correctly fits the given longitudinal and survival data (CD4 cell progression and time-to-mortality).
As a result, the Akaki Information Criteria (AIC) are used to compare these models and the Bayesian Information Criteria (BIC) for nested models are utilized at the 5% level of significance.

Where, -2 logL is twice the negative log-likelihood value for the model, P: number of estimated parameters and npar: the total number of parameters in the model, and N: total number of observations. The smaller values of AIC and BIC reflect an overall better fit.
Descriptive analysis of HIV/AIDS patients
216 HIV positive individuals who began Antiretroviral Therapy (ART) at Mekelle general hospital between September 1, 2014, and September 30, 2016, were included in the study. Of those patients, 36.6% had died, and the remaining 63.4% had been censored. Table 1 lists the baseline sociodemographic and clinical characteristics of the cohort trial. Out of these, 196 (90.7%) of the patients were men, and 68 (31.5%) of them died. When considering individuals with HIV/TB status, 133 (61.6%) of them also had TB infections, and 70 (32.4%) of them died. According to WHO stage, 106 patients (49.1%) were in WHO stage III or IV, and 43 patients (19.9%) died. Patients lived an average of 19.4 months, which was both their median and mean survival time. Moreover, different sociodemographic and clinical variables are summarized in Table 1.
| Status of patients | ||||
| Covariates | Categories | Total | Number of death (%) | Number of censored (%) |
|---|---|---|---|---|
| WHO stage | Stage I/II | 110 (50.9%) | 36 (16.7%) | 74 (34.25%) |
| Stage III/IV | 106 (49.1%) | 43 (19.9%) | 63 (29.2%) | |
| Sex | Female | 20 (9.3%) | 11 (5.1%) | 9 (4.2%) |
| Male | 196 (90.7%) | 68 (31.5%) | 128 (59.3%) | |
| HIV/TB status | No | 83 (38.4%) | 9 (4.2%) | 74 (34.3%) |
| Yes | 133 (61.6%) | 70 (32.4%) | 63 (29.2%) | |
| Function status | Working | 138 (63.2%) | 36 (16.7%) | 102 (47.2%) |
| Ambulatory/bedridden | 78 (36.1%) | 43 (19.9%) | 35 (16.2%) | |
| Marital status | Single | 153 (70.8%) | 51 (23.6%) | 102 (47.2%) |
| Married/separated | 63 (29.2%) | 28 (12.96%) | 35 (16.2%) | |
| Education level | Illiterate/elementary | 154 (71.3%) | 52(24.1%) | 102 (47.2%) |
| Secondary/tertiary | 62 (28.7%) | 27(12.5%) | 35 (16.2%) | |
| Median | Mean | Minimum | Maximum | |
| Survival time | 19 | 18.4 | 6 | 26 |
Table 1. Summary of descriptive statistics for Sociodemographic and clinical variables at MGH, (n=216).
Exploring individual profile
Exploratory data analysis was carried out to examine the many structures and patterns that emerged from the investigation of the data collection. The examination of individual profiles conducted by the authors prior to the application of joint modeling is crucial for forecasting the evolution of subsequent measurements of CD4 cells throughout time. The patient profile plots were crucial for gaining an understanding of the data's variability and determining which random effects should be taken into account in the linear mixed model analysis. In order to test the assumption of normality, a linear mixed effect model analysis of change on CD4 cell measurement has been carried out following an exploratory data analysis of the development of square root transformed CD4 cells. Therefore, individual profile plots of HIV/AIDS patients were utilized to identify the association between the change in √(CD4 cell) progression measurement and visiting follow-up periods (Figure 1).

Figure 1. Individual profile plot of CD4 cells progression for 72 sample ART patients over time, Mekelle general hospital, 2014-2016.
On the basis of the joint model, the longitudinal sub-model on the progression of CD4 cell count and the survival sub-model on causespecific hazards of mortality progression were both given statistically significant impacts (Table 2). The outcomes of the longitudinal submodel for CD4 cell progression are displayed in Table 2. According to the findings, patients who were also infected with (β=-0.125; and p<0.001*), as well as the follow-up visit time (β=-0.005 and p<0.001*), had a statistically significant impact on the CD4 cell count progression at the 5% level of significance. Additionally, individuals who were co-infected with TB (AHR=3.63; and p<0.002*) and WHO stage III or IV (AHR=1.7; and p<0.0384*), were statistically linked to an increased risk of mortality (the survival sub-model) at the 5% level of significance.
Additionally, there was a statistically significant negative relationship between the two response variables, CD4 cells count progression and time to mortality (α=-9.4; and p<0.0001*). The findings of the combined model's results indicate that patients with an increasing progression of CD4 cells count are more likely to have a lower risk of mortality.
| Parameter | Separate model of linear mixed model | Longitudinal sub model | ||||||
|---|---|---|---|---|---|---|---|---|
| Fixed effect | ˆβ | Se(ˆβ) | T-value | P-value | ˆβ | Se(ˆβ) | Z-value | P-value |
| Intercept | 18.8 | 0.03 | 621.9 | 0.0000* | 18.8 | 0.03 | 627.3 | <0.0001* |
| Visiting time | -0.004 | 0.0006 | -5.8 | 0.0000* | -0.005 | 0.0007 | -7.3 | <0.0001* |
| Sex (ref.=female) | ||||||||
| Male | 0.0026 | 0.0279 | 0.09 | 0.93 | 0.0048 | 0.0277 | 0.17 | 0.86 |
| Marital status (ref.=single) | ||||||||
| Married/separated | -0.018 | 0.0353 | -0.52 | 0.6 | -0.003 | 0.0338 | -0.099 | 0.92 |
| Education level (ref.=secondary/tertiary) | ||||||||
| Illiterate/elementary | 0.0206 | 0.0357 | 0.59 | 0.56 | 0.0057 | 0.0342 | 0.166 | 0.87 |
| Function status (ref.=working) | ||||||||
| Bedridden/ambulatory | 0.0046 | 0.0203 | 0.23 | 0.82 | 0.0058 | 0.0203 | 0.288 | 0.77 |
| WHO stage (ref.= Stage I/II) | ||||||||
| Stage III/IV | 0.0171 | 0.0159 | 1.077 | 0.28 | 0.0166 | 0.0158 | 1.05 | 0.29 |
| HIV/TB status (ref.=no) | ||||||||
| Yes | -0.124 | 0.0199 | -6.24 | 0.0000* | -0.125 | 0.0199 | -6.29 | <0.0001* |
| Separate model analysis of cox proportional hazard model | Survival sub model | |||||||
| Parameters | CHR | Se(β) | Z-value | P-value | AHR | Se(β) | Z-value | P-value |
| Sex (ref.=female) | ||||||||
| Male | 0.51 | 0.3527 | -1.893 | 0.0584 | 0.5 | 0.389 | -1.78 | 0.074 |
| Education level (ref.=secondary/tertiary) | ||||||||
| Illiterate/elementary | 1.9 | 1.0688 | 0.617 | 0.5373 | 3.1 | 1.373 | 0.82 | 0.42 |
| Function status (ref.=working) | ||||||||
| Bedridden/ambulatory | 1.27 | 0.2587 | 0.911 | 0.3623 | 1.29 | 0.272 | 0.925 | 0.355 |
| WHO stage (ref.= Stage I/II) | ||||||||
| Stage III/IV | 1.27 | 0.2311 | 1.03 | 0.3031 | 1.7 | 0.255 | 2.071 | 0.0384* |
| Marital status (ref.=single) | ||||||||
| Married/separated | 0.61 | 1.0733 | -0.463 | 0.6437 | 0.45 | 1.337 | -0.591 | 0.555 |
| HIV/TB status (ref.=no) | ||||||||
| Yes | 5.9 | 0.3891 | 4.55 | 0.001* | 3.63 | 0.417 | 3.1 | 0.002* |
| Association | -9.4 | 1.819 | -5.16 | <0.0001* | ||||
| Random effect | Variance | Std. dev | Variance | Std. dev | ||||
| (Intercept) | 0.000146 | 0.01207 | 0.0125 | 0.112 | ||||
| Time | 0.00001 | 0.00003 | 0.000025 | 0.005 | ||||
| Residual | 0.00001 | 0.00229 | 0.002304 | 0.048 | ||||
| AIC | 754 | -746 | ||||||
Note: *indicates significant p-value<0.05; ref.=reference group; CHR: Crude Hazard Ratio; AHR: Adjusted Hazard Ratio, Std. Dev.: Standard Deviation
Table 2. Compares the study of individual and combined models √(CD4 cell) on time-to-mortality follow-up from ART (n=216).
The goal of the current analysis was to pinpoint the key joint predictor factors and their relationships, two of which were the progression of CD4 cell and the time to death for HIV/AIDS patients who started ART at MGH in Northern Ethiopia. The results of this recent study showed that patients who had concurrent infections with TB (β=-0.125 and p<0.001*) and visiting time of follow-up (β=-0.005 and p<0.001*) were having a statistically significant impact on a declining CD4 cell count over time. Additionally, WHO stage III or IV (AHR=1.7 and p<0.0384*) and patients who were co-infected with TB (AHR=3.63 and p<0.002*) were statistically connected to an elevated risk of mortality.
Additionally, a statistically significant negative relationship existed between the two response variables, CD4 cell count progression and time to mortality (α=-9.4; and p<0.0001*).
Results from the combined model analysis indicated that patients with an increasing progression of CD4 cell count tended to have a lower risk of mortality. This was supported by the acquired estimation. The retrospective longitudinal data was unbalanced because some patients did not adhere to the prescribed period plan, were measured at different time periods, and had different amounts from patients who were connected to them. The time measure was applied on a monthly basis; however, for some patients, possibly due to their lack of follow-up, a six months interval program did not function. The most important predictor of mortality, according to multiple studies included in this study or article, is the WHO stage of the infection. Other studies that were conducted outside of Ethiopia revealed similar findings [12]. The majority of patient deaths caused by advanced WHO stage infections demonstrated the benefit of starting an ART regimen earlier than necessary before the disease progresses.
On the other hand, related TB co-infections were found to be a significant cause of death in patients who were HIV-positive and alive in low-income countries. This could be a result of the fact that TB is a major cause of death worldwide and that HIV/AIDS patients have an impaired immune system, which makes it easier for the mycobacterium to infect them [13]. The results of this statistical longitudinal sub-model also showed that patients who had TB and were co-infected had slower CD4 cell progression than patients who did not have TB. Ethiopia's Adama referral hospital and medical college and Jimma university specialized hospital both had similar findings to this study [14-18]. This indicates that TB positive patients develop infections more quickly than TB negative people.
The advancement of the change in CD4 cell count was negatively associated with the visit time follow-up since the start of ART [19]. This demonstrates that even though a patient's shift in CD4 cell development was linked to his or her earlier visitation time, it weakened with the growing time between points. Despite conflicting findings, there was a direct correlation between the evolution of CD4 cell count and the visit time follow-up in a month. This indicates that HIV patients' CD4 cell progression increased during the course of the numerous successively monitored periods [20]. In addition, some researchers claimed that starting at 3 months, a higher cumulative proportion of time spent visiting sites with viral loads below 400 copies/ml was substantially related to a greater favorable variation in the evolution of CD4 cell counts [21]. Finally, the combined model analysis' connection parameters show a statistically significant difference from zero, assuming that there is evidence of a relationship between the two sub-models. The parameter estimate for the relationship parameter resulting from CD4 cell progression is negative. Additionally, the statistical significance of the two connection parameters has led some to conclude that a combined model analysis is better than separate models.
In order to simultaneously study the important effects of predictor factors on the change in CD4 cell count progression and the risk of patient mortality, the authors used that statistical joint model, which provides a flexible framework. The association parameter change of CD4 cell progression on the chances of mortality events was also evaluated by this combined model analysis.
The ethical review committee of Gondar university’s college of natural and computational science approved this study. The names of HIV positive patients were not recorded in the extracted questionnaire, and their unique identifying numbers for ART had been locked for privacy reasons, according to the management of Mekelle general hospital.
[Crossref] [Google Scholar] [PubMed]
[Crossref] [Google Scholar] [PubMed]
[Crossref] [Google Scholar] [PubMed]
[Crossref] [Google Scholar] [PubMed]
[Crossref] [Google Scholar] [PubMed]
[Crossref] [Google Scholar] [PubMed]
[Crossref] [Google Scholar] [PubMed]
[Crossref] [Google Scholar] [PubMed]
[Crossref] [Google Scholar] [PubMed]
Journal of AIDS & Clinical Research received 5264 citations as per Google Scholar report