Research Article - (2021) Volume 0, Issue 0
Received: 25-Mar-2021
Published:
15-Apr-2021
, DOI: 10.37421/2151-6219.2021.s2.003
Citation: Upadhayay, Neha B . “Protection Begets Protection? Role of Retaliation in Anti-Dumping Case Filing.” Bus Econ J S2 (2021):003.
Copyright: © 2021 Upadhayay NB. This is an open-access article distributed
under the terms of the Creative Commons Attribution License, which permits
unrestricted use, distribution, and reproduction in any medium, provided the
original author and source are credited.
In this paper we uncover the determinants of anti-dumping-a trade policy that has emerged as a serious impediment to free trade. Anti-dumping actions have flourished, starting with active use by developed nations or traditional users, transcending into escalating use by developing countries or new users. The motives of anti-dumping use have also evolved, including influence of political factors, growing importance of strategic concerns, macroeconomic conditions like exchange rates and GDP. Researchers have questioned whether anti-dumping filings may be motivated as retaliation against similar measures imposed on a country’s exporters. This is the focus of this paper, though we also control for other anti-dumping related indicators like past filing behaviour, cases filed globally and cases faced by the exporter. Using a large sample of anti-dumping users and their trade partners for a two decade period (1996-2015), we show that there exists marked heterogeneity in nations’ use of anti-dumping as a contingent protection mechanism. The focus of this paper is on retaliatory motives and we find evidence that this effect is masked at the aggregate level with insufficient statistical significance (except for select regions and income groups of countries), however, a sectoral analysis reveals that retaliation is a positive and significant determinant of current anti-dumping case filing activity for a select group of large importers. Another key result of this study is that a substitution effect exists between trade liberalisation (reduction of applied tariffs) and anti-dumping petitioning activity.
Anti-dumping • Retaliation • Protectionism • Contingent protection
Finger in his seminal work titled Dumping and Anti-dumping: the rhetoric and the reality of protection in industrial countries said, “Anti-dumping is ordinary protection with a grand public relations program”. His reasoning is straightforward when he says that anti-dumping is the fox that is in-charge of the hen-house. In other words, foreign dumping is the rhetoric used by trading nations to excuse contemporary protectionist measures. Whilst with an original objective of curtailing ‘unfair trade’, contingent protection measures provisioned by the world trade organization are increasingly becoming the means of introducing trade distortions [1].
A vast body of literature has explored the motivations for anti-dumping usage and its proliferation in developed and developing trading nations alike. A result that emerges from these studies is that the strategic motive of retaliation is a key factor contributing to the growth in anti-dumping regimes. This paper fits into this broader area of anti-dumping literature that focuses on prevalence of retaliation amongst users of anti-dumping. However, this paper contributes to literature in the following aspects. In the first place, it vastly expands the scope of study by using a large sample of contingent protection users since the formation of the WTO. To be precise, we look at the determinants of anti-dumping use intensity among the users of contingent protection with a special focus on the strategic motive of retaliation. Subsequently, this paper accrues key insights on to the glaring heterogeneity in strategic behaviour of importers by size of importer (by trade value), income levels and whether or not they fall in the traditional users ‘club’. Finally, by performing a comprehensive sectoral analysis, this paper unmasks the exact industries that have a role to play in retaliatory antidumping [2-6].
Consequently, The main findings can also be summarized in a threepronged way. First, on an aggregate (country) level, trading nations do not exhibit retaliatory behaviour when we control for imports, exchange rate and growth of countries in terms of GDP. Other factors related to anti-dumping behaviour are tested which show that on a country-level, cases filed by an importer against third countries, cases faced by the importer as well as exporter and a target with higher case filing experience are positive determinants of importer’s current case filing intensity. Second, at the aggregate level, retaliatory anti-dumping practices do not seem to exist across the board for large and small importers as well as new and traditional users of anti-dumping. A positive and significant relationship is discovered when countries are divided based on income levels. A positive relationship is observed in the case of upper and lower middle income countries, with a pronounced effect in the latter. Third, the mechanisms of retaliation become well-marked at the sectorial level when dis-aggregated study is conducted. Sectorial retaliatory dumping seems to be favored by the largest importers (including countries like the US, EU India, China and South Korea). The smaller importers do not seem to engage in retaliatory anti-dumping, however, like larger importers seem to target the countries that experienced anti-dumping users. The substitution effect of tariffs is evident in the top 10 large importers only (includes new liberalized emerging economies like India and South Korea).
Literature and evidence on anti-dumping
Within the realms of the political-economy approach, researchers have analysed the effect of macroeconomic factors on anti-dumping use and proliferation. Aggarwal, Knetter and Tharakan have highlighted that antidumping is used as a mechanism to dowse import competition and protect domestic producers [7-9]. Aggarwal emphasises that the calculation of ‘injury’, which is required to establish that dumping has taken place, are riddled with ambiguity and vary from one country to another. In the event of unfair and unnecessary protection being implemented through anti-dumping and other contingent protection measures, it is the consumers who lose due to the inability to organise and influence the governments undertaking such action. The proclivity to use anti-dumping has its roots in several macroeconomic factors like increased imports or rising trade deficits Feinberg, Aggarwal and Prusa appreciating real external value of domestic currency weakening economy manifested by lower GDP growth and lowering of tariffs [10-16].
On the topic of lowering tariffs, Moore and Zanardi question whether trade liberalization efforts have been undone through a substitution from tariffs to nontariff measures. At an aggregate level, Figure 1 hints at a possible substitution effect between tariffs and anti-dumping initiations (which is also corroborated by the results of Moore and Zanardi who find this effect exists only in a small group of heavy users of anti-dumping amongst developing nations) [16].

Figure 1: Initiations of contingent protection measures and global values of applied tariff (all products, %), 1995-2015.
With the emergence of newly industrialized developing countries, having a prominent role in the world economy and trade, several researchers have also focused on their escalating participation in anti-dumping usage emphasises the importance of analyzing developing countries’ expanded use of antidumping provisions [17].
First, it is because of their increased capacity to initiate and fight disputes at the WTO and second as an escape valve to manage overall trade liberalisation. While until the early 2000, the USA and European Union (EU) remained the highest users of anti-dumping provisions by the number of cases filed, on a metric of cases per million dollars of import the new users are more intense users of contingent protection (specially anti-dumping provisions). Finger et al. indicated that for the 1995-1999 period Brazil was five times and, India was seven times, more intense than the US in anti-dumping filings. Performing similar calculation this paper finds that India is five times more intense than the US in anti-dumping use for the period 2011-2015 [1].
Figure 2 shows the global top ten reporters and targets of anti-dumping cases in 1995-2015 and Figure 3 shows the number of cases filed per trillion dollar of import value for the same reporters for the period 2011-2015. For another representation of the proliferation of anti-dumping activity refer in Table 1.

Figure 2: Top reporters and targets of anti-dumping cases, 1995-2015.

Figure 3: Anti-dumping cases per trillion dollar of import for the period 2011-2015.
We can see that the intensity of usage of anti-dumping as a trade policy has steadily fallen in the high income category from 1995 to 2015. This same intensity, however, has augmented in the lower middle income and upper middle income group. Examining the most active industry sectors that initiate anti-dumping, we see that base metals and chemical sector are the most active in using anti-dumping policy with 41% of the total cases initiated in the 20 year period 1996 to 2015 (Figure 4).

Figure 4: Initiations of anti-dumping cases, 1996-2015.
| Income category | Number of cases | |||
|---|---|---|---|---|
| 1995-2000 | 2001-2005 | 2006-2010 | 2011-2015 | |
| High income | 365 (51%) | 538 (42%) | 365 (38%) | 422 (37%) |
| Lower middle income | 118 (17%) | 314 (25%) | 302 (31%) | 259 (23%) |
| Upper middle income | 229 (32%) | 423 (33%) | 300 (31%) | 450 (40%) |
| Total | 712 | 1,275 | 967 | 1,131 |
Table 1: Initiation of AD cases by reporting country income: Number of cases and intensity (1995-2015).
Retaliatory anti-dumping
Bown and Reynolds report that depending on the law firm involved, the private sector legal fees of petitioning a dispute at the WTO likely ranges from USD 250,000 to USD 750,000. In view of these high costs involved in dispute resolution, it is likely that countries may choose retaliation via anti-dumping over disputing an anti-dumping duty at the WTO [18].
The very threat of retaliation could also deter countries from imposing antidumping duties. Further, Feinberg and Reynolds suggest that retaliation is a strategic tool which can be used by a country to pressure the trade partner to remove its own anti-dumping measures against said country and that countries find it easier to retaliate via anti-dumping. Feinberg and Reynolds also ask whether anti-dumping filings are motivated as retaliation against similar measures imposed on a country’s exporters. They use data pertaining to 1996-2003 and find strong evidence that a significant share of anti-dumping filings world-wide can be interpreted as retaliation. They also differentiate between the theoretical motivations of ‘retaliation’ and ‘learning’ arguing that learning simply reflects changed awareness of the relative costs and benefits of bringing a case in contrast to retaliation which is motivated by a need to maintain credibility to deter future anti-dumping instigation [2,4,5].
Literature has recognized the growth in adoption of anti-dumping, as a defense mechanism and retaliation, specially in case of developing countries. This is the foundation of a prisoners’ dilemma type of game in international trade where the non-cooperative equilibrium is inferior to the cooperative equilibrium. Countries support their domestic industry by adopting retaliatory practices, however end up decreasing the world welfare by attenuating world trade levels. In this setting, repeated games can bring a cooperative equilibrium. By employing a sequential game, Bagchi show that a credible threat of anti-dumping action can deter dumping actions, which ultimately leads to a win-win situation for both domestic and foreign firms. However, information asymmetries may lead nations to act either aggressively or tactically. Thus the payoffs from anti-dumping that a initiator country receives can vary depending on the type of target it faces [19-21].
Whether retaliation is a definite determinant of current anti-dumping activity is governed by two prerequisites. First, the country (expected to retaliate) must have necessary experience with WTO systems to be able to file an anti-dumping initiation itself. Second, there must be sufficient trade with the anti-dumping imposing country to warrant a retaliatory response [1].
Documenting recent trends in the use of anti-dumping, researchers have observed that traditional users of anti-dumping are increasingly becoming targets at the hands of anti-dumping enforcement authorities of new users. For example, the USA has been target of 276 cases in the 1995-2015 period (against the 606 cases initiated by the USA against global exporters in the same period). New users (who mostly fall in the upper and lower middle income group of countries) could embark on the retaliation route partly because of their dropping tariffs and increased institutional capacities (as discussed before), and also in an effort to establish regional hegemony as their economic importance increases. Studies have demonstrated that the East Asian economies have been targets of anti-dumping actions by the traditional users. This may have provoked retaliatory response from the East Asian economies. Similarly, South Asian (particularly India and Pakistan) and Latin American nations (particularly Argentina, Brazil and Mexico) that have added institutional capacities to initiate protection measures have used them full throttle when other countries target them [22].
It is to be clarified that this paper captures part of the retaliation story in trade disputes because those targeted by anti-dumping have several options to respond. Response could be simply by inaction, retaliation via new antidumping petition or go directly to the WTO via a dispute resolution route. In this paper, we focus on the first and second route i.e. inaction and retaliation via an anti-dumping petition. Feinberg and Reynolds also find that contingent to large import flows, a retaliatory response from target to instigator country becomes likely, but this response is more likely to be via an anti-dumping case than a dispute at the WTO. While our results focus on only anti-dumping as the channel of retaliation, they sketch out the ways in which targets of antidumping petitions weigh out their options in deciding a response and we capture this through several determinants of anti-dumping [4].
Furthermore, extant literature has generally focused on country-level studies for the US, Niels and Francois on Mexico, and Prusa on the developed nations, however, to the best of our knowledge, there is no study that captures the mechanisms of anti-dumping retaliation at the industry level, leave alone both industry and country level. This paper has an intended scope to do just that: study the macro behaviour of trading nations in retaliatory anti-dumping, as well as, take a deeper dive into the sectoral mechanisms of retaliation in contingent protection [11].
At the country-level, the retaliatory action could be driven by strategic government officials or departments with a mandate to respond to an antidumping petition by a trade partner. The government agency responsible for anti-dumping petitioning may be more likely to make affirmative decisions against exporter countries who have targeted them (importer country) in the past. The sectors that the anti-dumping making department chooses could be a vector of political, economic and industry-influence factors. The legal wherewithal that a nation possesses is also an important determinant of a country engaging in retaliation. The examples of these country-level retaliation are wide-ranging. The US and Mexico, Brazil and Argentina, EU and India, have on average 1 anti-dumping case per year against each other in the two decade period 1996-2015. In country pairs with China as the target or instigator, the average number of cases per year go up by 2 to 7 times suggesting the presence of retaliatory motives. Consider the example of the European Union (EU) and China. Since its accession to the WTO in 2001 till 2015, China has been the target of 90 anti-dumping cases from the EU (averaging 6 cases per year). In the same period, China has targeted EU in 26 anti-dumping cases with an average 2 cases per year. In the case of China and US pair, the US has on average filed 7 anti-dumping cases per year against China since its accession to WTO. China on the other hand has filed on average 3 antidumping cases per year against the US. Thus, case based evidence points at a natural possibility that anti-dumping filings may be motivated as retaliation against similar measures imposed on a country’s exporters.
Considering the industry level 5 driver, as pointed out by Feinberg and Reynolds, it is possible that a case against an industry category in a particular country in year t-1 is filed at the behest of different group of firms than the subsequent case in the same sector in year t. They suggest a simple game to better understand the motivation of industry level filings. This paper expounds the game with a practical example. Let us begin with an assumption that the probability of success of an anti-dumping petition by the leather industry in Morocco is higher when an anti-dumping action was taken against it by the Indian leather industry in the previous year. Subsequently, let us consider two Moroccan firms A and B in the same leather industry producing different set of products, bags and belts respectively. Had an anti-dumping petition been filed against A (bags) in previous year, firm B (belts) will have a higher likelihood of filing an anti-dumping case in period 2 considering that the likelihood of the petition’s success are higher (recall our aforesaid assumption). The petition will of course be filed under the head of Leather industry. Thus retaliation by B (belts) is not at the firm level if the anti-dumping authority in Morocco is likely to consider past filings against the leather industry (and not just firm A (bags)) of Morocco into account when making decisions. Of the several instances of industry level retaliation, a recent example is of Israel and Turkey in the glass industry. In 2014, Turkey imposed anti-dumping duties to the tune of 53% on glass coming from Israel. These were followed up with Israel imposing duties on float glass imported from Turkey. The US-China tussle in tire industry has been heavily debated and girdled with continuous retaliatory actions since 2009. The US administration levied safeguard duties to the tune of 35% tariff in year one, 30% in year two and 25% in year three on tires coming from China in a bid to ‘protect’ domestic jobs in the auto industry. China retaliated by imposing anti-dumping (maximum 21.5%) and countervailing duties on US made special utility automotive in the same year. These were revoked in 2012. Again in 2015, the US imposed countervailing duties in addition to anti-dumping duties ranging from 9% to 22% on truck and bus tires coming from China. What is evident from this particular example is that the retaliatory behavior does not remain restricted to only one form of protection, but trespasses into the area of other contingent protection measures. Also, countries may target each other not specifically in the same product, rather the same industry, whether it is up or down the supply chain [23].
In the ensuing sections is provided the empirical model-including data, sample and empirical methodology (Section 1.3); followed by results at country level (Section 1.4) and sectoral levels (Section 1.5) including robustness tests; and, a conclusion (Section 1.6) of the study.
Emperical analysis
Sample and data: We use data from the World Bank’s Temporary Trade Barriers Database for the period 1996-2015. This data-set contains case wise details at product level for 51 countries that have used anti-dumping. In this analysis we exclude Taiwan (due to unavailability of macro-economic indicator data) and the Gulf Cooperation Council (GCC) countries (as they report antidumping activity as a group). Therefore, our sample consists of 49 active users of contingent protection, specifically anti-dumping [24]. For the list of contingent protection user countries refer (Table S1).
In the first stage of our analysis, we concentrate on the country-level indicators for the construction of the variables. To reiterate, we are examining the role of retaliation in current anti-dumping activity. The dependent variables of interest here is the number of anti-dumping protection cases filed at the WTO by an importing nation (i) against an exporter (e) in the year (t). We call this measure Casesiet.
The first primary explanatory variable, Retaliationei(t-1) is the number of anti-dumping cases filed by the (now) exporting nation against the (now) importing nation in the previous year 6. At the aggregate level, it is not clear why countries would retaliate using an anti-dumping petition against a country which has targeted it in a particular industry section. However, in increasingly protectionist stands, specially in developing countries, governments that have learnt the nuances of anti-dumping may use them to retaliate against initiators, irrespective of the target industry [15].
We employ a battery of anti-dumping related explanatory variables to examine what anti-dumping related factors, other than retaliatory motives, explain a country’s decision to file an anti-dumping case against trade partners. The first variable to this effect is Deflectioni(t−1) which is the number of antidumping initiations globally (net of the anti-dumping initiations by the importer country). Our intent of including this variable is that increased anti-dumping activity world-wide will lead to a substantial diversion of imports 7, thereby enhancing import competition pressure prompting elevated anti-dumping action from the importer itself. The next variable is Total AD initiatedi(t−1)which is the total cases filed by the importer country in the year t-1 net of the cases against the particular exporter. With this variable we endeavour to discern the strategic protectionist behaviour of a country in a particular year. A positive coefficient is consistent with a world in which the importing country is building protection as a matter of global trade policy. This may be reflective of the government and type of leadership, however, in this study, we desist from making an inference about these political aspects.
The next anti-dumping related variable is Cases facedi(t−1) which captures the anti-dumping cases against the importer by all countries (net of the cases by exporter) in the previous year. This is in line with anti-dumping echoing wherein different countries sequentially impose anti-dumping measures on the same product from the same exporter. corroborates this concept with US and EU anti-dumping petitions against China wherein a chain reaction is set in motion due to increased awareness about Chinese dumping or higher probability of affirmative action if an anti-dumping case is already filed by a third country. Going a step further, we include Cases facede(t−1) for the exporter. The importer may be prompted to initiate more anti-dumping cases against an exporter which is the target of intensified global anti-dumping with the same incentives of echoing [25,26].
As a final anti-dumping related explanatory variable, we include Experiencei(t−1) since countries with extensive experience with anti-dumping petition activity may have higher proclivity to initiate a case. This variable is the average annual number of anti-dumping petitions filed by the importer between 1995 and the year previous to the year of current petition (i.e. from 1995 to year (t−1)). The choice of the year 1995 is in line with Feinberg and Reynolds which coincides with the formation of the WTO. Again, we include this variable for the exporter (target country) as well (Experiencee(t−1)), to uncover whether there is intensified targeting of experienced users of anti-dumping. It is possible that experienced users are targeted less as they have the capacity to retaliate. It is also not unlikely that experienced users may be targeted more to deter their anti-dumping action against the (now) initiator. Therefore, we are agnostic about the impact of target’s anti-dumping experience on a country’s decision to file an anti-dumping petition against the target.
The next set of variables we use relate to the trade policy of a country. We include Tariffi(t−1) which is the applied 8 weighted mean tariff (all products (%)) from the World Bank (2020) to examine the effects of tariff movement on anti-dumping behaviour. Our expectation, specially for developing countries, is that lower tariff rates are substituted by increased anti-dumping activity. Hence we expect a negative sign on this coefficient. Next, we include a variable called Importsie(t−1) sourced from the DOTS, IMF (2019). Literature is replete with evidence of the positive link between imports and contingent protection activity.
The results in aforesaid works support the hypothesis that increased imports from the exporter are seen as a threat to domestic industry and hence lead to a surge in contingent protection activity. Finally, we include a dummy [27-29].
Trade Agreementie(t−1) which takes a value 1 if a trade agreement exists between the two trade partners. Tabakis and Zanardi investigate the effects of negotiation and implementation of trade agreements on the use of antidumping by member countries against non-member countries. Their results show a building-block effect of such trade agreements on multilateral trade cooperation when it comes to anti-dumping. However, it is important to state that we cannot disregard the potential endogeneity arising due to the fact that country-pairs self-select in trade agreements. As suggested by Baier and Bergstrand, this endogeneity of trade agreements biases the estimation of the impact of such agreements within a gravity framework. For the purpose of this analysis, we believe that the presence of a trade agreement could go both ways. It could lead to an increase in imports consequently resulting in more protection or, on the other hand, could lead to better economic relations between the countries, leading to reduced possibility of contingent protection. In view of this ambiguity, we declare an agnostic view on the role of trade agreements in anti-dumping propensity [30,31].
In the end, we include standard control variables to account for potential anti-dumping activity. First, we include GDP growthi/e(t−1) rate of the importer (case initiator) and the exporter (target) as macroeconomic determinants of anti-dumping activity. Knetter and Prusa have shown that one standard deviation fall in domestic real GDP increases filings by 23%. Bown and Feinberg find a negative correlation between GDP growth and anti-dumping activity. If the real GDP of the importer country grows negatively or stays stagnant, the domestic producers find it hard to be competitive against foreign exporters. Therefore, the domestic producers, and linked lobbies and influence groups, are inclined to pressurise the government to implement protectionist measures which may manifest in the form of anti-dumping instigation against foreign exporters and countries. On the other hand, with a growth in GDP, domestic consumption could increase resulting into increased imports which in turn could accentuate anti-dumping activity. Also, countries with higher GDP growth rate could have better institutional and legal capacities to instigate and maintain anti-dumping actions. Again, at this stage, we have an agnostic view on the sign of GDP growth which can have different effects in different subsamples of this study [16].
The importing and exporting country pair in year t-1. One of the first papers that made an empirical inference on the link between exchange rate and anti-dumping was by Feinberg. Using data pertaining to US anti-dumping filings against Brazil, Mexico, Japan and Korea, for 24 quarters between 1982 and 1987, he finds that a depreciation of the US dollar (i.e. higher bilateral exchange rate) against the foreign currency leads to significantly higher incidences of anti-dumping, specially against Japan. The explanation of this phenomenon is attributed to the lowering of foreign firm’s export prices to the US leading to higher chances of determination of material injury and therefore higher proclivity of filing anti-dumping petitions. Knetter and Prusa manifest opposite conclusions showing that US dollar depreciation decreases import penetration, ceteris paribus, making it less likely that an injury is materialised. Citing these two confounding results in their extensive literature review on antidumping, Blonigen and Prusa stipulate that the effect of exchange rate on anti-dumping is equivocal and depends on the importance of decision, i.e., dumping or injury. For the purpose of this study, we are inclined to argue that a decrease in real exchange rate (higher value of domestic currency in terms of the trading partner’s currency) implies that exports become more expensive and imports become cheaper; indicating a loss in trade competitiveness which could be a driver of increased anti-dumping [27].
Summary statistics for the country level analysis variables are provided in Table 2. In this study, we envisage a possible shifting of signs with respect to variables and controls from the previously established studies in literature. This is because unlike previous studies that focus on a select group of countries 10 and relatively shorter sample periods, we carry out an exhaustive study with all users of contingent protection (except Taiwan and the Gulf Cooperation Council) for a two decade period between 1996 to 2015. As robustness checks, we employ several sensitivity measures by dividing the sample by size of importer in terms of trade value, by income categories, segregating into traditional and new users of anti-dumping, and, excluding heavy users of anti-dumping in recent years.
| Variables | N | Mean   |  SD | Min. |  Max. | Source |
|---|---|---|---|---|---|---|
| Casesiet | 106,820 | 0.0366 | 0.326 | 0 | 17 | WTO (2019 d) |
| Retaliationei(t-1) | 106,820 | 0.0297 | 0.308 | 0 | 17 | |
| Deflectioni(t-1) | 106,820 | 233.5 | 58.55 | 118 | 365 | |
| Total AD initiatedi(t-1) | 106,820 | 4.666 | 0 | 78 | ||
| Cases facedi(t-1) (Initiator) | 106,820 | 2.385 | 6.007 | 0 | 57 | |
| Cases facede(t-1) (Target) | 106,820 | 1.28 | 4.25 | 0 | 57 | |
| Experiencei(t-1) (Initiator) | 106,820 | 4.487 | 8.306 | 0 | 41 | |
| Experiencee(t-1) (Target) | 106,820 | 2.075 | 6.078 | 0 | 41 | |
| ln Importsie(t-1) | 106,820 | 13.42 | 7.951 | 0 | 34.46 | DOTS, IMF (2019) |
| Tariffi(t-1) | 92,816 | 6.254 | 5 | 0 | 44.94 | World Bank (2020) |
| Trade Agreementie(t-1) | 106,820 | 0.115 | 0.319 | 0 | 1 | WTO (2019 c) |
| GDP growthi(t-1) (Initiator) | 105,576 | 3.91 | 3.764 | -14.81 | 18.29 | World Bank (2018) |
| GDP growthe(t-1) (Target) | 99,910 | 3.906 | 5.805 | -62.08 | 123.1 | |
| ln Real Exchange Rateie(t-1) | 70,947 | 2.62 | 2.73 | -4 | 11.65 | OECD (2019 a,b) |
Table 2: Summary statistics, Aggregate analysis.
Political economy literature suggests that non-tariff barriers like antidumping duties may pose a potential endogeneity problem with respect to the estimated impact from surge in imports. While research work has relied on lagging of independent variables as a strategy to tackle endogeneity, it is argued that lagging is almost never a robust solution to endogeneity problems in observational data. In our specific case, the strategy of lagging independent variables is different from tackling endogeneity. Lagging is employed to trace out the path dependence of independent variables used in our econometric analysis. We have three reasons for doing this. First, anti-dumping authorities look at past performance to decide on the merit of a filing (and petitioners take this aspect into account when deciding whether to file a case or not). Second, non-tariff barriers and trade defense instruments are often implemented in reaction to an unexpected or rapid increase in imports. Since we use annual trade data, our analysis cannot control for the exact date of implementation of each policy. Therefore, we have a risk of the estimate biased toward zero if not lagged, leading to an underestimation of the potentially negative treatment effect. Third, using lags ensures that we account for changes in trade, which do not follow immediately, but only after some time of adaptation [32].
Therefore, in this paper which focuses on retaliatory motives of antidumping users, we acknowledge that in terms of potential endogeneity, reverse causality is part of the explanation. Retaliation as a motive for greater anti-dumping activity is not new and countries have employed anti-dumping duties as the preferred tool when challenging countries that have targeted them in the past [33].
Estimation technique: Casesiet is a non-negative count variable, therefore, the regression technique preferred is a negative binomial regression, which is essentially a Poisson model with a flexibility to allow for over-dispersion (variance of observed counts is larger than the mean empirically). In a negative binomial model, an unobserved effect is introduced into the conditional mean. Since the data has a large number of zeroes, the distributional assumption of a negative binomial type model may also stand challenged. In this case, a common alternative is a Zero inflated negative binomial model. This type of model has two categories of zeroes i.e., first, the structural zeroes-occurring with a probability of one and second, sampling zeroes-occurring by chance. To distinguish between structural and sampling zeroes, the model warrants identification of some specific indicators. In this case, this would mean that some countries do not have the possibility to use anti-dumping. However, since the sample consists of only anti-dumping making countries (on the importer side), we do not find the zero inflated model applicable [34,35].
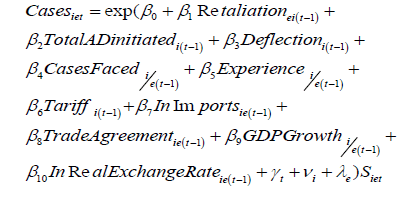
Coming to the choice of fixed effects versus random effects modelling, in case of panel data, fixed effects models are attractive for their ability to control for time invariant characteristics. In the case of count models (specially with over dispersion), a test like the Hausman test to choose between the two (fixed or random effects) is not considered appropriate as a true fixed effects method because it does not control for unchanging covariates. As a solution they suggest unconditional estimation of a fixed effects negative binomial model by including dummy (indicator) variables for all individuals, in this case the countries. Therefore, we include country and time dummies in all the specifications. However, for large samples, computational issues associated with the multiple fixed effects or time/country dummies, render the negative binomial regression models ineffective (models do not converge). To address this, we utilise the iterative poisson pseudo-maximum likelihood (PPML) estimation procedure that facilitates the inclusion of numerous fixed effects for large data sets and also allows for correlated errors across countries and time [36-38]. As a summary of the data and methods, we present the main estimation equation in its multiplicative form:
Baseline specification
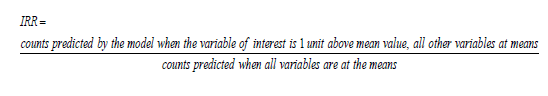
Estimation results in the form of Incidence Rate Ratios (IRR) are reported in Table 3. Since our study examines the intensity in terms of incidence of cases filed, like Knetter, Prusa and Teh we report IRRs to better gauge the number of events (case filings) taking place. IRR is the log of the ratio of expected counts. What we refer to as counts is technically a rate [23]. The explained variable Casesiet is the number of anti-dumping cases filed by an importer against an exporter in a year, which by definition, is a rate (since it is an event happening over a period of time) (Table 3).
| Variables | 1 | 2 | 3 | 4 | 5 |
|---|---|---|---|---|---|
| Retaliationei(t-1) | 1.070* | 1.071* (0.0404) | 1.068* (0.0390) | 1.063 (0.0485) | 1.046 (0.0510) |
| Deflectioni(t-1) | 1.001 (0.000685) | 1.001 (0.00069) | 1.002* (0.00123) | 1.001 (0.00132) | |
| Total AD initiatedi(t-1) | 1.016*** (0.00187) | 1.018*** (0.00238) | 1.017*** (0.0032) | 1.017*** (0.00271) | |
| Cases facedi(t-1) (Initiator) | 1.010* (0.00563) | 1.014* (0.00749) | 1.018** (0.00727) | ||
| Cases facede(t-1) (Target) | 1.013*** (0.005) | ||||
| Experiencei(t-1) (Initiator) 0.991 | 0.991 (0.00621) | 0.994 (0.00806) | 0.996 (0.00805) | ||
| Experiencee(t-1) (Target) | 1.028** (0.0109) | ||||
| ln Importsie(t-1) | 1.099*** (0.0401) | 1.093** (0.0391) | |||
| Tariffi(t-1) | 0.993 (0.00843) | 0.992(0.0084) | |||
| Trade Agreementie(t-1) | 1.394*** (0.138) | 1.402*** (0.138) | |||
| GDP growthi(t-1) (Initiator) | 1.030** (0.0124) | 1.030** (0.0117) | |||
| GDP growthe(t-1) (Target) | 1.006 (0.00998) | 0.997 (0.00916) | |||
| ln Real Exchange Rateie(t-1) | 0.690*** (0.0743) | Â 0.737*** (0.0750) | |||
| Constant | 0.0288*** (0.0109) | 0.0255*** (0.00916) | 0.0250*** (0.0103) | 0.344*** (0.205) | 0.384*** (0.230) |
| Observations | 86500 | 86500 | 86500 | 50032 | 50032 |
| No.of AD initiating countries | 49 | 49 | 49 | 49 | 49 |
| Â R2 | 0.47 | 0.475 | 0.475 | 0.493 | 0.507 |
Includes target side variables for experience and cases faced. Dependent Variable - Number of contingent protection Casesiet. Coefficients reported as incidence-rate ratios. Robust standard errors in parentheses. *** p<0.01, ** p<0.05, * p<0.1. All regressions include time dummies and country fixed effects. We have a balanced panel of 106,820 observations for 49 countries. However, the PPML excludes certain observations to ensure that estimates exist.
Table 3: Intensity of AD initiations: Poisson pseudo-maximum likelihood estimation (Incidence Rate Ratios), 1996-2015, Baseline specification.
In simple terms, counts predicted by the model when the variable of interest is 1 unit above mean value, all other variables at means
An IRR of less than 1 indicates a negative relationship between the dependent variable and the regressor. In the first column, we include only Retaliationei(t−1) as the regressor with country and time dummies and standard errors clustered at the country-pair level. We observe that the IRR is 1.07 and significant at the 1% level. However, on a step-wise addition of (i) anti-dumping related variables (column 2) (ii) trade policy variables (column 3) and (iv) Macroeconomic controls (column 4), we observe that the Retaliationei(t−1) variable is not statistically significant.
The variable that is consistently significant is Total AD initiatedi(t−1) indicating that the anti-dumping activity of a country against an exporter is correlated to its overall anti-dumping activity in the previous year. An interesting result that is evident from Table 3 is that echoing is a significant determinant of a country’s anti-dumping activity. As the Cases facedi(t−1)by a country increase, its own anti-dumping activity surges. This means a one-unit increases in cases faced would increase counts of anti-dumping activity by the importer by roughly 2%.
From the coefficient of Cases facede(t−1) (target) we observe that the importer also participates in the echoing phenomenon against the exporter (target) as the cases against exporter rise by about 1.3% for every one unit increase in cases that the exporter faces globally.
Regarding anti-dumping Experiencee(t−1), with respect to the target country, Feinberg and Reynolds show that retaliatory anti-dumping increases as the countries gain experience in anti-dumping filing activity. This may be a results of expenses plummeting as countries establish an order of anti-dumping activity. In our case, the dependent variable is anti-dumping cases and not retaliation. We see a positive correlation between anti-dumping activity against an exporter and its anti-dumping experience. This result supports the argument that more intense users of anti-dumping are also targeted more. This could be attributed to exporter’s past anti-dumping behaviour against the importer [4].
Like Moore and Zanardi we expect to observe a negative relationship between trade liberalisation and anti-dumping use, however, the coefficient of Tariffi(t−1) does not achieve nominal statistical significance (although the sign is negative as per our expectation). In case of Trade Agreementie(t−1), contrary to Tabakis and Zanardi we find that the presence of an agreement increases the expected counts of anti-dumping cases by 40%. This highly positive effect could be attributed to a rise in imports with the trading partner resulting in an escalation of anti-dumping cases. We must also note here that most Trade Agreement texts retain the WTO statue on anti-dumping measures, thereby not inducing dissuasion of anti-dumping initiations or measures [30].
In terms of economic performance, importer countries on a positive GDP growth path exhibit higher anti-dumping activity (coefficient of GDP growthi(t−1) is positively correlated to anti-dumping cases and statistically significant). We believe, this effect which is opposite to that observed by Knetter and Bown could be ascribed to two reasons. First, higher growth could lead to higher consumption making way for progressing imports, consequently, surge in antidumping activity. Second, higher growth could also describe the overall rising development in a country which could lead to added legal and institutional capacities capable of anti-dumping activity. The results for Importsie(t−1) show a positive relationship and and Real Exchange Rateie(t−1)show a negative relationship with rising anti-dumping activity which is in line with our expectation explained previously [12].
From Table 3, we observe that the Retaliationei(t−1) becomes statistically non-significant when controlling for the echoing effect, experience in antidumping activity of the initiator and target and other macro-economic factors. We suspect that the aggregate results may camouflage some importer size related or development level heterogeneity that may exist due to difference in anti-dumping use by countries. Researchers have frequently discussed the different behaviour in anti-dumping activity of the developed and developing countries or have focused on individual country behaviour. In further sections we tackle the question of retaliation based on size of importer by value of trade. We also perform the analysis based on income levels of countries to understand how the motive of retaliation affects anti-dumping activity of countries. For this part, we use the World Bank’s classification of income categories (World Bank, 2019) [39,40].
Anti-dumping activity by income level of importer
In Table 4, we present results obtained by estimating equation 1 segregating our observations by the level of income of the importer. We use income related divisions 13 specified by the World Bank (2019). We find that Upper and Lower middle income countries have a positive relationship in terms of Retaliationei(t-1) and anti-dumping activity. This effect is absent in case of the High income countries. However, the echoing effect is prominent and positive in the High income group of countries. Also, High income countries have a positive correlation between their own anti-dumping activity and the experience of the target country which is again suggestive of the fact that the current anti-dumping activity may be in response to previous anti-dumping activity from the (now) target (Table 4).
| Variable | High income (1) | Upper middle income (2) | Lower middle income (3) |
|---|---|---|---|
| Retaliationei(t-1) | 1.002 (0.054) | 1.097* (0.0586) | 1.284* (0.175) |
| Deflectioni(t-1) | 0.999 (0.00207) | 1.002 (0.00208) | 1.078*** (0.0115) |
| Total AD initiatedi(t-1) | 1.006 (0.00534) | 1.015** (0.00687) | 1.173*** (0.0286) |
| Cases facedi(t-1) (Initiator) | 1.082*** (0.0299) | 0.985 (0.0108) | 1.023 (0.0497) |
| Cases facede(t-1) (Target) | Â 1.026*** (0.00685) | 1.005 (0.00888) | 0.99 (0.0186) |
| Experiencei(t-1) (Initiator) | 0.998 (0.0176) | 1.052*** (0.0188) | 0.697*** (0.0526) |
| Experiencee(t-1) (Target) | Â 1.036** (0.0166) | 1.005 (0.0161) | 0.992 (0.0373) |
| ln Importsie(t-1) | 1.196(-0.226) | 1.434*** (0.124) | 1.336 (-0.25) |
| Tariffi(t-1) | 0.966 (0.0589) | Â 0.977 (0.0188) | Â 0.904** (0.0376) |
| Trade Agreementie(t-1) | 1.513(0.389) | 1.047(0.164) | 1.408 (0.34) |
| GDP growthi(t-1) (Initiator) | 1.096** (0.0459) | 1.007 (0.015) | 0.99 (0.0287) |
| GDP growthe(t-1) (Target) | 1.003 (0.0165) | 0.994 (0.0157) | 0.942** (0.0243) |
| ln Real Exchange Rateie(t-1) | 1.068 (0.156) | 0.432*** (0.0597) | 1.459 (0.568) |
| Constant | 0.00102*** (0.00188) | 0.118* (0.131) | 0.0*** (0) |
| Observations | 13,744 | 19,123 | 5,477 |
| No. of AD initiating countries | 18 | 21 | 10 |
| R2 | 0.557 | 0.442 | 0.341 |
Dependent Variable-Number of contingent protection Casesiet. Coefficients reported as incidence-rate ratios. Robust standard errors in parentheses. *** p<0.01, ** p<0.05, * p<0.1. All regressions include time dummies and country fixed effects.
Table 4: Intensity of AD initiations: Poisson pseudo-maximum likelihood estimation (Incidence Rate Ratios), 1996-2015, Income-wise analysis.
From the results, it can be seen that Upper middle income countries (prominent anti-dumping users being Argentina, Brazil, China, Colombia, Mexico, Malaysia, Thailand) see a surge in anti-dumping activity due to previous anti-dumping activity from exporters (Retaliation). In terms of other anti-dumping activity related variables, Total AD initiatedi(t−1) in the previous year and higher Experiencei(t−1) (Initiator) (learning by doing theory) in filing of anti-dumping cases are positively correlated with the country’s own antidumping activity.
In Lower middle income countries (prominent anti-dumping users are Indonesia, India, Morocco, Pakistan, Philippines and Ukraine) the positive effect of retaliation is almost three times that in the Upper middle income countries. A counter-intuitive finding is that in the Lower middle income countries, accumulating anti-dumping related experience leads to a drop in anti-dumping activity. This seems in contrast with the fact that Lower middle income countries like India have intensified their anti-dumping activity recent years. However, we may be overlooking the behaviour of other Lower middle income countries. In view of this, it becomes essential to conduct a sensitivity test with a sequential exclusion of intensive anti-dumping initiators (Table S3). For this group of countries, we see a statistically significant substitution effect between tariffs and anti-dumping activity, which is in consonance with the fact that most countries in this group have recently liberalised their economies, however, increasing their anti-dumping activity to protect domestic industries.
Anti-dumping activity of traditional vs. new users
Feinberg and Reynolds suggest that early 2000 have seen a tremendous growth in the anti-dumping ‘club’ with new users becoming increasingly active in anti-dumping initiations. Traditional users include the USA, the EU, Australia, and Canada (all High income countries) while the New users of anti-dumping are amongst the Low and Upper middle income economies like India, Mexico, Brazil, South Africa and Argentina. There is a newfound interest in the rapid spread of anti-dumping in these economies since a surge in their anti-dumping activity is seen as a means to overturn the effects of recent liberalization [29].
In Table 5, we see marked differences in the anti-dumping behaviour of traditional and new users. While Retaliationei(t−1) is not statistically significant for both these groups, Total AD initiatedi(t−1) and Deflectioni(t−1)are positive and significant determinants of anti-dumping activity in case of the new users of anti-dumping. The echoing effect is prominent in case of traditional users who seem to target exporters who are already being targeted by other importers as well as if they have themselves been targeted intensely in previous year. The substitution effect of Tariffi(t−1) is evident in the new users where anti-dumping activity has a negative correlation with rate of applied tariff. Also, in the new users group, Real Exchange Rateie(t−1) has a negative correlation with antidumping activity, which is in line with the argument that a higher domestic currency value leads to a loss in export competitiveness and increased imports, thereby, resulting in increased anti-dumping activity (Table 5).
| Variables | Â Traditional users (1) | New users (2) |
|---|---|---|
| Retaliationei(t-1) | 0.978(0.0432) | 1.053(0.0521) |
| Deflectioni(t-1) | 1(0.00236) | 1.006** (0.00291) |
| Total AD initiatedi(t-1) | 1.003 (0.0052) | 1.030*** (0.00367) |
| Cases facedi(t-1) (Initiator) | 1.050*(0.0305) | 1.005(0.00938) |
| Cases facede(t-1) (Target) | 1.019***(0.0061) | 0.998 (0.00632) |
| Experiencei(t-1) (Initiator) | 1(0.0193) | 0.997(0.0112) |
| Experiencee(t-1) (Target) | Â 1.030*(0.0163) | 1(0.015) |
| ln Importsie(t-1) | 1.549*** (0.125) | 1.346*** (0.112) |
| Tariffi(t-1) | 1.014 (0.0778) | 0.976** (0.0118) |
| Trade Agreementie(t-1) | 1.11 (0.259) | 0.826 (0.134) |
| GDP growthi(t-1) (Initiator) | 1.026 (0.0745) | 0.991 (0.0113) |
| GDP growthe(t-1) (Target) | 1.004 (0.0175) | 1.009 (0.0137) |
| ln Real Exchange Rateie(t-1) | 0.921 (0.141) | 0.486*** (0.0773) |
| Constant | 0.104** (0.111) | 0.742 (0.983) |
| Observations | 4,570 | 5,513 |
| No. of AD initiating countries | 5 | 5 |
| R2 | 0.558 | 0.609 |
Dependent Variable-Number of contingent protection Casesiet. Coefficients reported as incidence- rate ratios. Robust standard errors in parentheses. *** p<0.01, ** p<0.05, * p<0.1. All regressions include time dummies and country fixed effects. We have 106,820 observations. However, the PPML excludes certain observations to ensure that estimates exist.
Table 5: Intensity of AD initiations: Pseudo Poisson maximum likelihood model (Incidence Rate Ratios), 1996-2015, Traditional and new users of AD.
Anti-dumping activity by size of trade
To better interpret the characteristics of countries that impose antidumping duties as retaliatory measures, we split our sample based on the size of trade 14. From Table 6 we observe that, when it comes to retaliation at the country level, the group of countries consisting of large importers like China, EU, India and the US are no different from group of countries with smaller countries (in terms of trade value) like Honduras, Jamaica and Costa Rica. For the Top 20 countries in terms of trade value, we find that Cases facedi(t−1) (Initiator) is positive and statistically significant indicating that as the cases faced by the importer country increase, its own anti-dumping activity also surges. For the largest importers, Experienceei(t−1) (Initiator) is negative and significant. This may be attributed to probable backlog of cases or just an overall reduction in anti-dumping activity due to probable falling back on other protectionist mechanisms. For the top 11 to 20 importers, including new users of anti-dumping in South Asia like Malaysia and Thailand, Experiencei(t−1) (Initiator) is positive and significant indicating an escalation in anti-dumping activity attributable to recently acquired experience and capacities. It is worth noting that most of the Top 11-20 countries by trade value are the new users of anti-dumping with the exception of Australia (Table 6).
| Variables | Top 10 by value of trade(1) | Top 11-20 by value of trade(2) | Bottom 11-20 by value of trade(3) | Bottom 10 by value of trade(4) |
|---|---|---|---|---|
| Retaliationei(t-1) | 1.043 (0.0474) | 1.069 (0.0909) | 1.041 (0.038) | 0.889 (0.0653) |
| Deflectioni(t-1) | 0.999 (0.00138) | 1.006*(0.00317) | 0.996 (0.0132) | 1.066*** (0.00604) |
| Total AD initiatedi(t-1) | 1.009*** (0.00332) | 1.015 (0.00929) | 0.935 (0.0915) | 0.465 (0.389) |
| Cases facedi(t-1) (Initiator) | 1.025*** (0.00736) | 1.054** (0.027) | 3.898*** (2.006) | 4.549 (5.611) |
| Cases facede(t-1) (Target) | 1.023*** (0.00605) | 0.999 (0.00975) | 0.975 (0.021) | 0.897** (0.0477) |
| Experiencei(t-1) (Initiator) | 0.975** (0.0103) | 1.062*** (0.0228) | 1.586 (0.602) | 1.584 (3.505) |
| Experiencee(t-1) (Target) | 1.02 (0.0126) | 1.006 (0.0159) | 0.998 (0.0468) | 1.283* (0.164) |
| Tariffi(t-1) | 0.984* (0.00985) | 0.860*** (0.0362) | 1.43 (0.33) | 1.028 (0.29) |
| ln Importsie(t-1) | 1.029 (0.0411) | 1.606*** (0.143) | 2.382*** (0.319) | 2.311** (0.772) |
| Trade Agreementie(t-1) | Â 1.349** (0.195) | 1.189 (0.18) | 1.616 (1.291) | 1.332 (1.065) |
| GDP growthi(t-1) (Initiator) | 1.068*** (0.02) | 1.033* (0.0204) | 1.443*** (0.149) | 0.889 (0.132) |
| GDP growthe(t-1) (Target) | 1 (0.0121) | 0.993 (0.0175) | 0.926* (0.0403) | 1.036 (0.149) |
| ln Real Exchange Rateie(t) | 0.982 (0.133) | 0.480*** (0.0698) | 0.798 (0.37) | 0.321 (0.603) |
| Constant | Â 0.344** (0.173) | 0.0119*** (0.015) | 0.298*** (0.162) | 0.13** (0.052) |
| Observations | 9,655 | 9,989 | 2,144 | 677 |
| R2 | 0.579 | 0.516 | 0.452 | 0.136 |
Dependent Variable-Number of contingent protection Casesiet. Robust standard errors in parentheses. *** p<0.01, ** p<0.05, * p<0.1. Top 10 importers by value of trade are Canada, China, EU, India, Japan, South Korea, Mexico, Russia, Singapore & US. Top 11-20 importers by value of trade are Argentina, Australia, Brazil, Indonesia, Israel, Malaysia, Thailand, Turkey, Vietnam & South Africa. Bottom 11-20 importers by value of trade are Bulgaria, Chile, Dominican Republic, Ecuador, Guatemala, Jordan, Lithuania, Panama, Peru, Slovenia. Finally, bottom 10 importers by value of trade are Costa Rica, Honduras, Jamaica, Kazakhstan, Latvia, Nicaragua, Paraguay, Trinidad & Tobago, Ukraine and Uruguay.
Table 6: Intensity of AD initiations: Poisson pseudo-maximum likelihood estimation (Incidence Rate Ratios), 1996-2015, Country level analysis based on size of importer in terms of trade value.
Total AD initiatedi(t−1) is positive and significant for the Top 10 importers indicating that anti-dumping activity by the importer in the preceding year could be positively correlated with their anti-dumping activity in the current year. It is important to reiterate that Total AD initiatedi(t−1) and Experiencei(t−1) (Initiator) are different from each other as the latter captures the stock of anti-dumping experience while the former is more temporal.
The substitution effect of lowered tariffs is evident from the negatively correlated and significant coefficients for the Top 20 importers in Table 6. This is indicative of the fact that large importers who have reduced tariffs have replaced them with contingent protection duties like anti-dumping duties.
All in all, the heterogeneity in anti-dumping activity is evident based on level of development, size of trade and experience of being anti-dumping users. This was presented in the aforesaid results. As a robustness check, we also provide an analysis based on regional divisions in the Table S4. In the next section, we endeavour to uncover more details based on sectoral anti-dumping activity.
Sectoral analysis
In previous sections, we have used an enlarged concept of retaliation, including any anti-dumping action filed by an exporter against an importer in the previous year, as a determinant of anti-dumping action by the importer against exporter in the current year. Looking back on research which has pointed out that anti-dumping policy is not equally applied across industries and, in fact, a simple count of case initiations (Figure 4) suggests that antidumping is concentrated in a few sectors. Therefore, in order to better uncover the mechanism of retaliatory anti-dumping as a strategic motive, we carry out an analysis with a focus on the industry dis-aggregation. Some of our variables change in the following way: in the aggregate analysis, the dependent variable Casesiet, was the number of anti-dumping cases filed by an importer against an exporter in a particular year. This variable is now constructed to include sectoral cases and notified as PCasesiest. Therefore, the variable has four dimensions now-importer, exporter, year and sector. Retaliationeis(t−1) is constructed in the same way as PCasesiest-to indicate the cases filed by (now) exporter e/target against the (now) importer i/initiator in sector s in previous year t-1. Note that this variable which is now binary, is essentially a count of anti-dumping cases. This is because, in our sample, at the industry level, there is only one case filed in a year by an importer against an exporter. While the target exporters may be several under one case head, the bilateral count of case in a particular sector in a year does not exceed one.
The other anti-dumping related variables i.e., Total AD initiatedi(t−1), Deflectioni(t−1), Cases facedi/e(t−1) (Initiator/Target) and Experiencei/e(t−1) (Initiator/ Target) have also been modified to include the sectoral component and therefore become Total AD initiatedis(t−1), Deflectionis(t−1), Cases facedi/es(t−1) (Initiator/Target) and Experiencei/es(t−1) (Initia-tor/Target). The source for this data remains the same i.e., World Bank’s Temporary Trade Barriers Database (Bown, 2016). Similarly Importsie(t−1) and Tariffi(t−1) of the baseline aggregate analysis transform into the Sectoral Importsies(t−1) and Sectoral Tariffis(t−1) in the sectoral dis-aggregate analysis. Data on sectoral imports is obtained from WTO (who extract it from UNCOMTRADE) and on sectoral tariffs from the Most Favoured Nation (MFN) tariffs applied by the reporting country/economy by sector available on a yearly basis at WTO Macro-economic control variables remain identical to the baseline aggregate analysis described previously.
Summary statistics for the variables used in the sectoral analysis specification are shown in Table 7 [41-43].
| Variables | N | Mean | SD | Min. | Max. | Source |
|---|---|---|---|---|---|---|
| PCasesiest | 2,159,388 | 0.0019 | 0.0434 | 0 | 1 | |
| Retaliationeis(t-1) | 2,159,388 | 0.0015 | 0.038 | 0 | 1 | |
| Deflectionis(t-1) | 2,159,388 | 9.696 | 15 | 1 | 99 | |
| Total AD initiatedis(t-1) | 2,159,388 | 0.201 | 1.058 | 0 | 33 | Bown (2016); WTO (2019 d) |
| Cases facedis(t-1) (Initiator) | 2,159,388 | 0.154 | 0.645 | 0 | 13 | |
| Cases facedes(t-1) (Target) | 2,159,388 | 0.09 | 0.474 | 0 | 13 | |
| Experienceis(t-1) (Initiator) | 2,159,388 | 0.209 | 0.789 | 0 | 17 | |
| Experiencees(t-1) (Target) | 2,159,388 | 0.098 | 0.552 | 0 | 17 | |
| ln Sectoral Importsies(t-1) | 2,159,388 | 5.502 | 7.055 | 0 | 26.17 | WTO (2019 d) |
| Sectoral Tariffis(t-1) | 1,509,759 | 10.55 | 11.51 | 0 | 216.4 | WTO (2020) |
| Trade Agreementie(t-1) | 2,159,388 | 0.11 | 0.309 | 0 | 1 | WTO (2019 c) |
| GDP growthi(t-1) (Initiator) | 2,062,317 | 3.946 | 3.962 | -22.93 | 18.29 | World Bank (2018) |
| ln Real Exchange Rateie(t-1) | 1,406,931 | 2.608 | 2.747 | -4.163 | 10.84 | OECD (2019 a,b) |
Table 7: Summary statistics, Sectoral analysis.
As can be observed, the dependent and main independent variable transform from a count type of distribution to a binary distribution i.e., taking values 0 or 1, due to disaggregation. Therefore, the estimation technique changes in the sectoral analysis from count models to technique used for dichotomous or binary outcome variables 16. Standard ordered probit models cannot account for the preponderance of zero observations when the zeros relate to an extra, distinct source. Since our data also has a large number of zeroes, the distributional assumption of a probit model may stand challenged. In this case, a common alternative is a Zero inflated probit model. However, like the aggregate model, the presence of a large number of zeroes is neither structural nor due to sampling. The zero inflated model would be applicable if our sample had countries that do not have the possibility to use anti-dumping (like non-WTO members). However, since the sample consists of only antidumping making countries (on the importer side), we do not find the zero inflated probit model applicable.
The sectoral analysis is carried out using the following specification of maximum likelihood estimation technique where the dependent variable is PCasesiest, i.e. if an anti-dumping case is filed by an importer against an exporter in a particular year in sector s (1) or if not
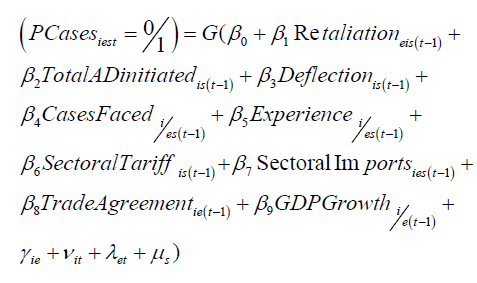
The likelihood for country i to instigate a case against country e is defined as follows where G represents the link function that follows a standard normal cumulative distribution function. It is assumed that the error term is independent and normally distributed. One way of controlling unobserved heterogeneity is using a specification with importer*exporter*sector (ies), importer*exporter*year (iet), importer*sector*year (its) and exporter*sector*year (ets) fixed effects. However, due to computational limitations in introducing so many high level fixed effects, this is rendered unfeasible. Therefore, we use the importer*year (it), exporter*year (et), importer*exporter (ie) and sector (s) fixed effects in the above specification. Additionally, since the probit estimators can be biased due to the incidental parameter problem, we use the special command (probitfe 17) to arrive at our estimates [43].
Econometric results obtained from sectoral analysis
Sectoral anti-dumping activity baseline specification: In case of a probit model, the coefficients cannot be directly interpreted. So, in order to comment on the magnitude of the coefficients, we have calculated and reported the average marginal effects. We report results with and without target side variables related to echoing and experience. Since the primary focus of this paper is on whether there is an evidence of Retaliationeis(t−1) in filing anti-dumping petitions, we focus on this variable first. In Table 8 we see evidence that on a sectoral level Retaliationeis(t−1) has a positive influence on the propensity of anti-dumping petitioning. The coefficients are positive and significant at the 1% level indicating that at a sectoral level, retaliation does determine anti-dumping activity. This helps us uncover the potential of retaliation which was not evident in the aggregate study (Tables 3 and S2). The interpretation of probit margins coefficients is as follows: Retaliationeis(t−1) increases the probability of a country to file an anti-dumping case against an exporter in sector s by 35 percentage points (Column 2 of Table 8) compared to a scenario when there was no case by the exporter against the importer in the previous year. The estimate is statistically significant at a 1% level (Table 8).
| Variables | All Sectors (1) | All Sectors (2) |
|---|---|---|
| Retaliationeis(t1) | 0.747***(0.0543) | 0.353*** (0.0635) |
| Deflectionis(t1) | 0.00209***(0.000480) | 0.0107*** (0.000647) |
| Total AD initiatedis(t1) | 0.150***(0.00315) | 0.170***(0.00342) |
| Cases facedis(t1) (Initiator) | 0.0200***(0.00622) | 0.0636***(0.00681) |
| Cases facedes(t1) (Target) | 0.262*** (0.00555) | |
| Experienceis(t1) (Initiator) | 0.0236***(0.00564) | 0.00921(0.00614) |
| Experiencees(t1) (Target) | 0.0879*** (0.00602) | |
| ln Sectoral Importsies(t1) | 0.0852***(0.00204) | 0.0625***(0.00196) |
| Sectoral Tariffis(t1) | 0.00207***(0.000602) | 0.00152** (0.000678) |
| Trade Agreementie(t1) | 0.0242(0.0216) | 0.0412*(0.0231) |
| GDP growthi(t1) (Initiator) | 0.00455(0.00295) | 0.00182(0.00314) |
| GDP growthe(t1) (Target) | 0.0388***(0.00231) | 0.00467*(0.00268) |
| ln Real Exchange Rateie(t) | 0.00242(0.00338) | 0.00433(0.00366) |
| Constant | 0.0953*(0.0506) | 0.592*** (0.0560) |
| Observations | 10,75,571 | 10,75,571 |
| Pseudo R2 | 0.35 | 0.42 |
Includes target side variables for experience and cases faced. Dependent Variable- Contingent protection PCasesiest. Results of the probit regression (pro- bitfe command (Cruz-Gonzalez et al., 2017)) have been reported with average marginal effects. Robust standard errors in parentheses. *** p<0.01, ** p<0.05,* p<0.1.
Table 8: Determinants of AD initiations, Probit regression analysis, 1996-2015, Baseline specification on sectoral level.
` With respect to other anti-dumping related variables, we see a positive effect in the Total AD initiatedis(t−1) cases filed by a country in the previous year. This result suggests that sectors which initiate anti-dumping petitions in a particular year have a history of anti-dumping petitioning in the previous year, throwing light on the fact that targeting is sticky and persists for atleast 2 years as shown by our analysis. Deflectionis(t−1) (number of anti-dumping initiations worldwide, exclusive of the importing country, in sector s) is negatively related to anti-dumping activity. Our results are different from Moore and Zanardi who show that anti-dumping actions in third countries can increase the probability that a sector may file an anti-dumping petition against a partner. In our case, this effect is the opposite and seems to favour the argument that trade deflection is negative indicating that sectors do not target a partner country if there are higher anti-dumping cases by third countries against this particular sector. It seems that a sector cares less about deflected trade at the sectoral level on a short run of one year. Deflected trade as a motivation of anti-dumping can be investigated for periods of two or three years lag, however, this is not covered in this paper [15].We also see consistent evidence that echoing is a positive and significant determinant of anti-dumping activity at the sectoral level. Cases faced by an importer itself in a certain sector will have a positive influence on its own antidumping activity in that sector. This is also true with respect to the target where we see that sectors are more likely to file a petition against a partner country in a sector which is already being targeted by third countries attributable to purported reasons like reputation of dumping being high in case of the named sector.
In terms of experience at filing cases, we see that sectors in countries with higher anti-dumping experience are targeted more, while the importer’s own sectoral case filing experience is negatively linked to anti-dumping activity. While the first result related to Experiencees(t−1) (Target) is identical to the baseline aggregate results, the negative effect of Experienceis(t−1) (Initiator) with anti-dumping activity is negative and significant. This indicates that sectors that have more experience or familiarity in anti-dumping activity see a drop in anti-dumping filings. This may be driven by the fact that past anti-dumping activity may have been a deterrent to dumping (from exporter) leading to a lower likelihood of requiring an anti-dumping action from the importer.
Unlike the aggregate specifications seen in previous section, we do not see the substitution effect of sectoral tariffs. Other control variables have coefficients in line with the aggregate results.
Like Vandenbussche and Viegelahn we find that anti-dumping policy for importers is not equally applied across industries. As discussed in the introduction of this paper, a simple count of case initiations suggests that anti-dumping protection policy is concentrated in a few sectors (Figure 4). Of course, the caveat is that these figures are not representative of either the industry size or product scope within each industry. It is for this reason our sectoral analysis is carried out for all industry sectors (21 sections of the Harmonized System). However, when performing the analysis for industry sectors one by one, we observe that the chemicals and base metals sectors are significant in using anti-dumping as a retaliatory force. These results are corroborated by regression results presented in Table S5 Other sectors which have a positive link between retaliation and current anti-dumping activity are plastics and rubber, paper and wood, machinery and mechanical appliances and vehicles and transport equipment. For rest of the 15 sectors, retaliation and anti-dumping activity have scant statistically significant relationship. To better visualise the sectoral analysis with respect to strategic motive of retaliation, Figure 5 shows the predicted values of anti-dumping PCasesiest varying Retaliationeis(t−1), holding all other variables at mean (for continuous variables) and at median (for categorical variables) [41].

Figure 5: Retaliation by Sector (predicted values of cases filed vs. indicator for retaliation).
Sectoral anti-dumping activity of traditional vs. new users of antidumping: In Table 9, we show the results of regressions on sectoral level sub-samples of Traditional and New users of anti-dumping. The results from these sub-samples are coherent with the sectoral baseline specification (Table 8) with Retaliationeis(t−1) being a positive determinant of anti-dumping activity at the sectoral level both in case of traditional and new users of anti-dumping. Other anti-dumping related variables broadly retain the signs and significance from the sectoral level baseline results (Table 9).
| Traditional (1) | Traditional (2) | New (1) | New (2) | |
|---|---|---|---|---|
| Retaliationeis(t1) | 0.640***(0.122) | 0.294**(0.138) | 0.806***(0.0635) | 0.420***(0.0742) |
| Deflectionis(t1) | 0.00293**(0.00120) | 0.0109***(0.00149) | 0.00382***(0.000531) | 0.00770***(0.000722) |
| Total AD initiatedis(t1) | 0.111***(0.00555) | 0.135***(0.00609) | 0.176***(0.00395) | 0.193***(0.00425) |
| Cases facedis(t1) (Initiator) | 0.0259(0.0168) | 0.0932***(0.0181) | 0.0224***(0.00786) | 0.0179**(0.00856) |
| Cases facedes(t1) (Target) | 0.294***(0.0136) | 0.245***(0.00618) | ||
| Experienceis(t1) (Initiator) | 0.0148(0.00907) | 0.00122(0.00981) | 0.0116(0.00781) | 0.0180**(0.00842) |
| Experiencees(t1) (Target) | 0.0750***(0.0138) | 0.0839***(0.00683) | ||
| ln Sectoral Importsies(t1) | 0.182***(0.00671) | 0.133***(0.00692) | 0.0706***(0.00212) | 0.0517***(0.00204) |
| Sectoral Tariffis(t1) | 0.00967*(0.00546) | 0.008(0.00571) | 0.000371(0.000912) | 0.000524(0.000977) |
| Trade Agreementie(t1) | 0.172***(0.0547) | 0.0691(0.0574) | 0.0234(0.0246) | 0.0915***(0.0262) |
| GDP growthi(t1) (Initiator) | 0.0925***(0.0213) | 0.0739***(0.0222) | 0.0023(0.00335) | 0.00126(0.00357) |
| GDP growthe(t1) (Target) | 0.0386***(0.00513) | 0.000887(0.00578) | 0.0396***(0.00266) | 0.00765**(0.00310) |
| ln Real Exchange Rateie(t) | 0.185***(0.0531) | 0.235***(0.0556) | 0.00947**(0.00411) | 0.0105**(0.00436) |
| Constant | 7.48***(0.562) | 5.256***(0.532) | 3.851***(0.190) | 2.485*** (0.166) |
| Observations | 1,22,360 | 1,22,360 | 9,53,211 | 9,53,211 |
| Pseudo R2 | 0.4 | 0.459 | 0.351 | 0.416 |
Dependent Variable-Number of contingent protection PCasesiest. Robust standard errors in parentheses. *** p<0.01, ** p<0.05, * p<0.1.The specification include target related variables for echoing and experience. Coefficients are estimated using probitfe command (Cruz-Gonzalez et al., 2017)
Table 9: Determinants of AD initiations: Probit regression analysis, 1996-2015, Traditional and new users of AD on sectoral level.
Sectoral Tariffis(t−1) exhibits the substitution effect, albeit, this is statistically significant only in case of traditional users. However, even for the new users while statistical significance is not achieved, the negative coefficient is quite intuitive as almost all the new users have recently witnessed trade liberalisation and have almost concurrently become heavy users of anti-dumping. The mechanisms of Experienceis(t−1) (Initiator) become further clear where again we can see that new users with higher acquired experience in terms of antidumping case filing will have higher proclivity to initiate cases (Table S6) [44-47].
Sectoral anti-dumping activity by size of importers: With the sectoral analysis pertaining to size of importers shown in Table 10 we are able to see that current anti-dumping activity of large importers (Top 10) in a specific sector has a positive and significant relationship with anti-dumping activity for exporter in the same sector in the previous period. We must take note that this result is in line with the estimates obtained in Table 9 where we see that both traditional and new users of anti-dumping evidence a similar relationship between PCasesiest and Retaliationeis(t−1). It is to be noted that the Top 10 large importer group consists of both new and traditional users of anti-dumping (Tables 10 and S7).
| Variables | Top 10 by value of trade (1) | Top 11-20 by value of trade (2) | Bottom 11-20 by value of trade (3) | Bottom 10 by value of trade (4) |
|---|---|---|---|---|
| Retaliationeis(t1) | 0.302***(0.0763) | 0.0922(0.169) | 0.135(0.143) | 0.287(0.369) |
| Total AD initiatedis(t1) | 0.135***(0.00431) | 0.176***(0.00667) | 0.681***(0.0687) | 0.732***(0.0582) |
| Deflectionis(t1) | 0.0140***(0.00102) | 0.0117***(0.00148) | 0.0106***(0.00293) | 0.0105***(0.00368) |
| Cases facedis(t1) (Initiator) | 0.0516***(0.00852) | 0.0354(0.0277) | 0.275***(0.0876) | |
| Cases facedes(t1) (Target) | 0.347***(0.00955) | 0.286***(0.0112) | 0.151***0.0333) | 0.251***(0.0245) |
| Experienceis(t1) (Initiator) | 0.0304***(0.00729) | 0.0993***(0.0172) | 0.510**(0.223) | 0.117(0.115) |
| Experiencees(t1) (Target) | 0.109***(0.00932) | 0.0894***(0.0123) | 0.0571(0.0588) | 0.0740***(0.0266) |
| Sectoral Tariffis(t1) | 0.00934***(0.00155) | 0.00419*(0.00248) | 0.00269(0.0122) | 0.00311(0.0125) |
| ln Sectoral Importsies(t1) | 0.0652***(0.00321) | 0.0429***(0.00322) | 0.120***(0.0172) | 0.0583***(0.00963) |
| Trade Agreementie(t1) | 0.052(0.0374) | 0.0489(0.0441) | 0.00344(0.150) | 0.768***(0.105) |
| GDP growthi(t1) (Initiator) | 0.0107**(0.00480) | 0.0245***(0.00839) | 0.0293(0.0238) | 0.00744(0.0201) |
| GDP growthe(t1) (Target) | 0.00501(0.00397) | 0.0125**(0.00504) | 0.0318*(0.0166) | 0.0133(0.0140) |
| ln Real Exchange Rateie(t) | 0.0074(0.00894) | 0.111***(0.0179) | 0.00128(0.0396) | 0.0658***(0.0254) |
| Observations | 2,49,869 | 2,27,468 | 1,49,027 | 2,23,288 |
| Pseudo R2 | 0.433 | 0.407 | 0.462 | 0.574 |
Dependent Variable-Number of contingent protection PCasesiest. Robust standard errors in parentheses. *** p<0.01, ** p<0.05, * p<0.1. Coefficients are estimated using probitfe command (Cruz-Gonzalez et al., 2017) (Cruz-Gonzalez et al., 2017). Top 10 importers by value of trade are Canada, China, EU, India, Japan, South Korea, Mexico, Russia, Singapore & US. Top 11-20 importers by value of trade are Argentina, Australia, Brazil, Indonesia, Israel, Malaysia, Thailand, Turkey, Vietnam & South Africa. Bottom 11-20 importers by value of trade are Bulgaria, Chile, Dominican Republic, Ecuador, Guatemala, Jordan, Lithuania, Panama, Peru, Slovenia. Finally, bottom 10 importers by value of trade are Costa Rica, Honduras, Jamaica, Kazakhstan, Latvia, Nicaragua, Paraguay, Trinidad & Tobago, Ukraine and Uruguay.
Table 10: Determinants of AD initiations: Probit regression analysis, 1996-2015, Sectoral analysis based on size of importer in terms of trade value.
We obtain reinforced evidence about Deflectionis(t−1) which is negatively correlated with current anti-dumping activity at the sectoral level indicating that sectors do not target a partner country if there are existing cases by third countries against the particular sector. The Cases facedis(t−1) (Initiator) is positive and significant for the Top 10 importers but negative and significant for the bottom 10 importers. This is evidence that bigger importers increase their anti-dumping activity in the sector where they are themselves targeted by third countries while for smaller importers the effect is negative. This could be evidence of the strength that industry lobbies hold in smaller importer nations which may deter from petitioning further if already faced with cases themselves. Cases facedes(t−1) (Target) is statistically significant and positive across the board indicating that small and large importers alike target partner countries in a sector which is already being targeted by third countries (Table S8) [48-52].
Before concluding this section, it is important to state that subsequent to the aggregate analysis, we carry out sectoral analysis on the sample of anti-dumping users and different sub-samples. What we observe from the results based on the whole sample (Table 8) is that retaliation seems to be a determinant of sectoral anti-dumping activity. However, this result does not seem enough to point into the direction of the countries driving this result. Subsequently, we carry out the analysis on a sub-sample of traditional and new users to uncover that retaliation is a statistically significant determinant of higher anti-dumping activity. Furthermore, we split the sample based on size of importer and find that retaliation is a significant determinant for antidumping case filing only for the Top 10 importers. This is coherent because of the Top 10 importers (by trade value) 8 are from the traditional and new user group. Therefore, we have been able to identify the group of countries that use retaliation strategy in their anti-dumping case filing decision at the sectors level (Table S9) [53-60].
study contributes to the broader literature of contingent protection concerning the strategic motives of anti-dumping activity (Anti-dumping being over 85% of contingent protection). We focus on the particular aspect of retaliation since recent years have seen a surge in ‘tit for tat’ behaviour in terms of tariffs and non-tariff measures by leading economies of the world. We begin with an aggregate country level analysis and find that retaliation is not a strategic motive for anti-dumping activity. The strategic retaliatory motive is uncovered at the importer’s size and income level of countries with Lower and Upper middle income countries having higher incidences of retaliation in anti-dumping petitions. Upon a deeper dive into sectoral analysis, we find that retaliatory practices do exist at the sector level albeit only for a select group of large importers. As many other researchers have found in narrower settings, we find robust evidence that sectors are more likely to file anti-dumping cases against countries and sectors where petitions have been filed against them in the past. This effect is positive and significant for large importers, however, does not manifest in smaller importers. Strategic considerations in the use of anti-dumping are also evident through other indicators like total anti-dumping cases that a country files, the global use of anti-dumping (deflection), targeting countries that are already being targeted by third nations (echoing) and accumulating anti-dumping petitioning related experience.
The results of this study also support the proposition that countries are more likely to file anti-dumping petitions when applied tariffs are declining. We find this negative correlation between applied tariffs and anti-dumping activity across all the sub-samples in the aggregate analysis. In the sectoral analysis, the results are mixed with a substitution effect becoming evident in case of traditional users or anti-dumping and the top 11-20 countries by trade size. The empirical evidence that this paper presents reinforces the viewpoint that increased imports are seen as a threat to domestic industry and may lead to an increased anti-dumping activity as a channel of local industry protection enhancement.
On a final note, there certainly maybe other channels of retaliation for protection that we are not able to capture in this study. However, we are assured that the other forms of protection are sparse while anti-dumping is the most conspicuous form of trade protection. The results of this paper suggest that as more and more countries use anti-dumping, the use of anti-dumping as a trade remedy intensifies, in developed as well as developing countries. Nevertheless, it would be interesting to see the escalation of other NTMs in response to contingent protection.
Business and Economics Journal received 6451 citations as per Google Scholar report


