Research Article - (2024) Volume 13, Issue 5
Received: 16-Sep-2024, Manuscript No. Jacm-24-148069;
Editor assigned: 18-Sep-2024, Pre QC No. P-148069;
Reviewed: 02-Oct-2024, QC No. Q-148069;
Revised: 07-Oct-2024, Manuscript No. R-148069;
Published:
02-Nov-2024
, DOI: 10.37421/2168-9679.2024.13.579
Citation: Haque, Mojammel, Most Halimatuj Sadia and Laek Sazzad Andallah. “Simulation and Analysis of Diffusion Type Traffic Flow Model Using Linear and Exponential Velocity Density Relationship.” J Appl Computat Math 13 (2024): 579.
Copyright: © 2024 Haque M, et al. This is an open-access article distributed under the terms of the Creative Commons Attribution License, which permits unrestricted use, distribution, and reproduction in any medium, provided the original author and source are credited.
In our modern era, traffic congestion in big cities has become threat for our daily life. It is one of the greatest problems in many developed countries of the world like Bangladesh. Various mathematical models have been employed to address the issue of traffic congestion. Traffic flow models assume that density and velocity are related. Bruce Greenshields first introduced traffic density-velocity connection. In this paper, we would like to study with linear velocity density relationship (Greenshields Model) and exponential velocity density relationship (Underwood Model) using the model for the flow of traffic based on diffusion. To make a comparative study between Greenshields and Underwood Models we solve the traffic flow model of the diffusion type as analytically as well as numerically. Due to analytical solution complexity, we use the finite difference method to solve the model numerically. We use explicit upwind, explicit centered, and explicit Lax-Wendrooff schemes to solve the model numerically. For each of the schemes, we present a comparison between linear and exponential velocity-density relationships. From this comparison, we can say that the exponential velocity- density relationship is appropriate to overcome the traffic congestion problem for each of the schemes.
Traffic congestion • Velocity-density relation • Analytical solution • Numerical solution • Greenshields model • Underwood model
For the management of traffic situations, Highways, streets, and other transportation networks are vital. They make the transportation of persons and products more efficient as well as more convenient. The constantly expanding number of cars on urban streets and highways, together with the economic and social ramifications such auto collision prevention, pollution, and energy regulation, led me to study traffic flow modelling. In particular, the rising number of automobiles on metropolitan roads in recent years. Congestion in the transportation system is a constant problem in our nation. An accurate traffic flow model is needed to reduce congestion. There have been three major approaches in mathematical traffic flow modeling which describes situations due to different assumptions, amplifications, and modifications. In this paper, we consider a macroscopic traffic flow model namely “traffic flow model of the diffusion type” developed by Khune in 1971 [1] to show the traffic diffusivity. A second class of models based on individual behavior is also known as macroscopic models [2], and it includes the car-following models in which the driver changes his or her acceleration depending on the situations in front of them. In our paper we would like to give attention to comparing Greenshields and Underwood models [3,4] utilizing the model of the macroscopic fluid dynamics since it is more useful and simpler to execute than other modeling techniques, with the primary emphasis being placed on the evaluation of numerical solutions.
The governing equations for traffic flow with greenshields and underwood model
For the purpose of analyzing traffic patterns, the fluid dynamic traffic flow model is utilized. This model makes use of a set of collective variables that change depending on the location (x), velocity (v), and density (u) of the road network. Based on the conservation of mass Lighthill and Whitham and by Richards [5,6] suggested a fluid dynamic model,

This is known as the LWR fluid dynamics traffic flow model. This model is unable to explain traffic diffusivity that’s why in 1984 Khune contributed a phrase for diffusion with the LWR model [7]. That is,

This model represents a second-order diffusion model of traffic flow. We use the velocity density relationship.

This velocity density relationship is known as the Greenshields model.
And a non-linear (exponential) velocity-density relationship [Underwood Model] which is of the form:

Where vmax denotes maximum velocity (free-flow speed) and umax denotes maximum density (jam density).
Analytical methods to solve the governing equation
The linear relationship between speed and population density in the Lighthill-Whitham-Richards (LWR) traffic flow model is analyzed using the characteristics approach as described in reference [8].

And with exponential velocity-density relationship is,

The Cole-Hopf transformation yields the following as the exact solution to the traffic flow model of the diffusion type [2]

Where  is the initial condition
However, due to the solution's integrodifferential shape and the difficulty of its evaluation, the traffic flow model of the diffusion type is solved by a numerical approach.
Numerical method to solve the governing equation
It is common knowledge that the assessment of the analytical approach using the diffusion- type traffic management model might be considered to be rather difficult. So, we need to get the numerical solution. Here we use finite difference method to solve the model numerically [9]. This section focuses on the discussion of the FTBSCS scheme, explicit centered difference scheme, and Lax-Wendroff scheme as numerical solutions for the partial differential equation (PDE) [10].
Explicit upwind (ftbscs) scheme
In this method, the forward difference formula is used to approximate the first order temporal derivative, the backward difference formula is used to approximate the first order spatial derivative, and the center difference formula is used to approximate the second order spatial derivative. These approximations collectively comprise the explicit upwind or FTBSCS scheme.

For Greenshields model,
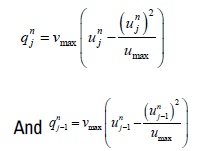
For Underwood model,
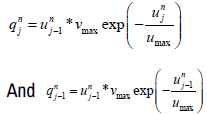
Explicit centered difference scheme or FTCSCS scheme
In this context, we employ the forward difference formula to approximate the first order temporal derivative. Additionally, we utilize the central difference formula to approximate both the first order spatial derivative and the second order spatial derivative. By combining these approximations, we obtain the FTCSCS scheme.

For Greenshields model,
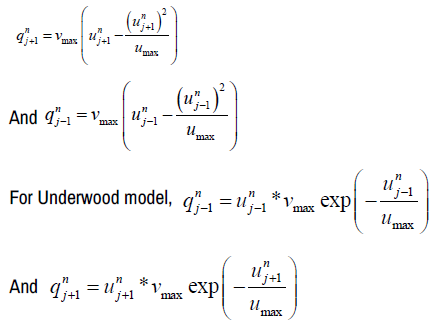
Explicit Lax-Wendroff scheme of second order
The explicit Lax-Wendroff scheme for the traffic flow model of diffusion type involves discretizing a portion of the scheme using the half time step Lax- Friedrich scheme. This discretized value is then incorporated into the half-step Leapfrog scheme. Subsequently the central diffusion portion is merged with the schemes described before to provide the explicit 2nd-order Lax-Wendroff scheme for the diffusion type of traffic flow model [11].
The utilization of the forward difference formula for the first-order time derivative and the central difference formula for the first-order spatial derivative results in the establishment of the Lax-Friedrich scheme. The Lax- Friedrich approach is,

The Lax-Friedrich system is now being employed for the half-time step,

Applying the central difference formula to the first-order derivatives of both time and space yields the leapfrog scheme,

Leave-frog scheme for half step is,

The central difference formula is employed to discretize the second order spatial derivative,

Now combining leave-frog scheme for half step, lax-friedrich scheme for half step and central diffusion term we get the Lax-Wendroff scheme.
For Greenshields model the scheme is,
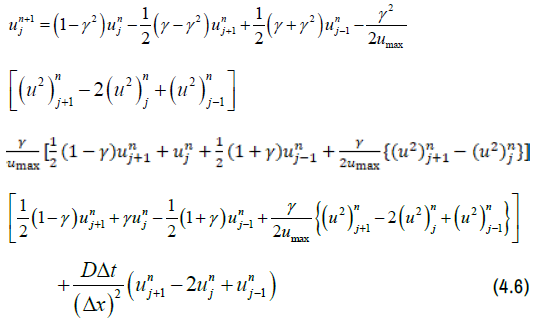
For Underwood model the scheme is,
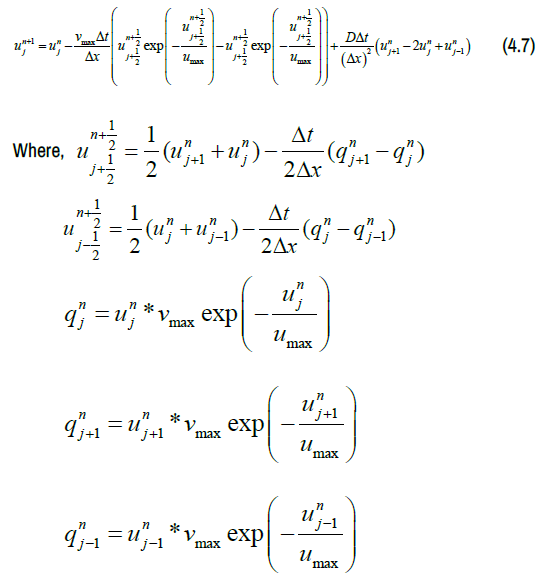
The stability criterion of numerical schemes
Convex combination and Von-Neumann techniques are used to determine the requirements for stability of the FTBSCS, explicit centered, and explicit 2nd order Lax-Wendroff Scheme [12]. The following is the Stability Requirement of the Explicit Upwind Difference Scheme

The stability requirement of an explicit centered difference scheme,

Furthermore, Lax-Wendroff scheme stability requires that,

Assumptions for the simulation
In order to conduct a comparative analysis of the Greenshields and Underwood models, our initial objective is to simulate a diffusion-type traffic flow model. This will be accomplished by employing explicit upwind, explicit centered, and Lax-Wendorff schemes. In this study, periodic boundary conditions are employed as both the start and left boundary conditions. The Neumann boundary condition is employed as the boundary condition on the right side. In the simulation, the spatial domain utilized for all three methods encompasses a range of 0 to 10 kilometers. The maximum velocity of the cars is denoted as vmax, with a value of 60 kilometers per hour. The numerical experiment was conducted for a duration of 3 minutes, using a temporal grid size of 0.3 seconds, a spatial grid size of 0.05 km, and a diffusion constant of D = 0.1 Km2/Min [13,14].
Density profile using explicit upwind (FTBSCS) scheme for both linear and exponential velocity-density relationship (i.e, greenshields and underwood model)
Based on the aforementioned assumptions, we conducted numerical experiments to observe the density profile for duration of 3 minutes or 180 seconds. These experiments were conducted using a traffic flow model that incorporates a velocity-density connection and diffusion-type features. The purpose of these experiments was to analyze the dynamics of traffic characteristics in relation to both spatial and temporal factors. In Figure 1 it represents the car density of the traffic flow model with respect to highway in km for initial time and consecutive 3 minutes. The curve marked by “solid red line” represents car density at initial time, the curve visible by “—”(dashed line) with blue line at 1 minute, the curve visible by “:” (colon) with megenta color represents car density at 2 minutes and the curve represented by “green solid line” shows the car density at 3 minutes. We use same things for all the three schemes to present the comparison between Greenshields and Underwood model for each of the density, velocity and flux profile.
Comparison of density profile using greenshields and underwood model
Here we compare the car density between Greenshields model and Underwood model at different times. We perform the comparison with same initial and boundary condition, maximum velocity, maximum density, parameters. In Figure 2, it represents the comparison of car density between Greenshields and Underwood model at different times. The Underwood model has a solid red line for car density, while the Greenshields model has a dashed line.
After comparing car density between Greenshields Model and Underwood model at different times, some observations are given below:
1. Maximum or minimum car density for a particular time is equal for using both Greenshields and Underwood model.
2. Using Greenshields model attains its maximum car density faster than using Underwood model with respect to highway in km at a particular time, i.e., the density curve using Greenshields model is steeper than the density curve using Underwood model while the time is progressed.
Velocity profile in case of explicit upwind scheme of the traffic flow model of the diffusion type using greenshield and underwood model
As like with the density profile we present the velocity profile and comparison using Greenshields and Underwood model (Figure 3).
Comparison of velocity profile using greenshields and underwood model
Here we compare the car Velocity using Greenshields model and Underwood model at different times as like with the density profile (Figure 4).
After comparing car Velocity between Greenshields Model and Underwood model at different times, some observations are given below:
1. The car velocity using Underwood model is always greater than the car velocityu sing Greenshields model with respect to highway in km for any time.
Therefore, cars using Underwood model are much faster than cars using Greenshields model at respective different times.
Flux profile in case of explicit upwind scheme of the traffic flow model of the diffusion type using greenshield and underwood model
As like with the density, velocity profile we present the flux profile and comparison using Greenshields and Underwood model (Figure 5).
Comparison of flux profile using Greenshields and Underwood Model
Here we compare the car Velocity using Greenshields model and Underwood model at different times as like with the density profile (Figure 6).
After comparing car flux using Greenshields Model and Underwood model at different times, some observations are given below:
1. Minimum car flux for a particular time is equal for using both Greenshields and Underwood model.
2. The Flux curve using Underwood model is steeper than the flux curve of Greenshield model while the time is progressed.
Density profile using explicit centered difference (ftcscs) scheme of traffic flow model of diffusion type with greenshield and underwood model
Under the same assumption with explicit upwind scheme in this section we present the density, velocity and flux profile with the help of explicit centered difference scheme.
The density profile using explicit centered difference scheme at different time is shown by the (Figure 7).
Comparison of density profile using greenshields and underwood model
As like with the comparison using Greenshields and Underwood model in case of explicit upwind scheme, here we present the comparison using Greenshields and Underwood model in case of explicit centered difference scheme (Figure 8).
After comparing car density using Greenshields Model and Underwood model at different times, some observations are given below:
3. Maximum or minimum car density for a particular time is equal for using both Greenshields and Underwood model.
4. Using Greenshields model attains its maximum car density faster than using Underwood model with respect to highway in km at a particular time, i.e., the density curve of using Greenshields model is steeper than the density curve of using Underwood model while the time is progressed.
Velocity profile in case of explicit centered difference scheme of traffic flow model of diffusion type using greenshield and underwood model
As like with the density profile here we present the velocity profile in case of explicit centered difference scheme (Figure 9).
Comparison of velocity profile between Greenshields and underwood model
Here we compare the car velocity using Greenshields model and Underwood model at different times as like with the density profile (Figure 10).
After comparing car Velocity using Greenshields Model and Underwood model at different times, some observations are given below:
• The car velocity using Underwood model is always greater than the car velocity using Greenshields model with respect to highway in km for any time. Therefore, cars using Underwood model are much faster than cars using Greenshields model at respective different times.
Flux profile in case of explicit centered difference scheme of traffic flow model of diffusion type using greenshield and underwood model
As like the density, velocity profile flux profile is presented here (Figure 11).
Comparison of flux using greenshields and underwood model
Here we compare the car flux using Greenshields model and Underwood model at different times as like with the velocity profile (Figure 12).
After comparing car flux using Greenshields Model and Underwood model at different times, some observations are given below:
1. Minimum car flux for a particular time is equal for using both Greenshields and Underwood model.
2. The Flux curve using Underwood model is steeper than the flux curve using Greenshields model while the time is progressed.
Density profile in case of Lax-Wendroff scheme of second order of traffic flow model of diffusion type using greenshield and underwood model
Under the same assumption with Explicit upwind scheme in this section we present the density, velocity and flux profile in case of explicit second order Lax-Wendroff scheme.
The density profile in case of explicit second order Lax-Wendroff scheme at different time is shown by the (Figure 13).
Comparison of density profile between greenshields and underwood model
As like with the comparison using Greenshields and Underwood model in case of explicit upwind scheme, here we present the comparison using Greenshields and Underwood model inc ase of lax-wendroff scheme (Figure 14).
After comparing car density using Greenshields Model and Underwood model at different times, some observations are given below:
· Maximum car density using Greenshields model is greater than using Underwood model in the density curve.
· Using Underwood model it is capable to reduce car density faster than using Greenshields model.
Velocity profile in case of lax-wendroff scheme of second order of traffic flow model of diffusion type using greenshield and underwood model
As like with the density profile here we present the velocity profile in case of Lax-Wendroff scheme of second order (Figure 15).
Comparison of velocity profile using greenshields and underwood model
Here we compare the car velocity using Greenshields model and Underwood model at different times as like with the density profile (Figure 16).
After comparing car velocity using Greenshields Model and Underwood model at different times, some observations are given below:
• Cars using Underwood model are much faster than cars using Greenshields model at respective different times.
Flux profile in case of Lax-Wendroff scheme of second order of traffic flow model of diffusion type using greenshield and underwood model
As like with the density profile here we present the flux profile in case of Lax- Wendroff scheme of second order (Figure 17).
Here we compare the car flux using Greenshields model and Underwood model at different times as like with the density profile (Figure 18).
After comparing car flux using Greenshields Model and Underwood model at different times, some observations are given below:
1. Maximum or minimum flux using Greenshields model for a particular time is not equal to using Underwood model in this case.
2. The Flux curve using Greenshields model is steeper than the flux curve using Underwood model while the time is progressed.
In this work, we simulate the diffusion type traffic flow using linear and exponential velocity density relationship. we also give a comparison using the Greenshields and Underwood models utilizing explicit upwind, explicit centered, and second order Lax-Wendroff schemes. It is shown that using Greenshields model it has a larger maximum car density than using the Underwood model by comparing the density profiles generated by the explicit upwind, explicit centered, and second order Lax-Wendroff schemes. Using Underwood model it is capable to reduce car density faster than using Greenshields model. From the comparison of velocity profile generated by explicit upwind, explicit centered, and Lax-Wendroff schemes it is seen that the car velocity using Underwood model is always greater than the car velocity using Greenshields model with respect to highway in km for any time. Therefore, cars using Underwood model are much faster than cars using Greenshields model at respective different times. From the comparison of flux profile, we observe that The Flux curve using Greenshields model is steeper than the flux curve using Underwood model while the time is progresses. So, from the comparison of density, velocity and flux profile using Greenshields and Underwood model it can be concluded that using Underwood model gives faster flow than using Greenshields model shows a better fit for the traffic flow model of the diffusion type.
This research did not receive any specific funding.
I would like to thank my supervisor Prof. Dr. Laek Sazzad Andallah for supporting the entire work.
The authors declare no conflicts of interest regarding the publication of this paper.
Journal of Applied & Computational Mathematics received 1282 citations as per Google Scholar report