Research Article - (2023) Volume 11, Issue 4
Received: 30-May-2023, Manuscript No. jbes-23-100698;
Editor assigned: 01-Jun-2023, Pre QC No. P-100698;
Reviewed: 15-Jun-2023, QC No. Q-100698;
Revised: 21-Jun-2023, Manuscript No. R-100698;
Published:
30-Jun-2023
, DOI: 10.37421/2332-2543.2023.11.483
Citation: Waktura,Temesgen Hordofa. “Structure and Regeneration Status of Woody Species in the Debelle Forest, Central Highlands of Ethiopia.” J Biodivers Endanger Species 11 (2023): 483.
Copyright: © 2023 Waktura TH. This is an open-access article distributed under the terms of the Creative Commons Attribution License, which permits unrestricted use, distribution, and reproduction in any medium, provided the original author and source are credited.
This study evaluates the structure and regeneration status of woody species in the Debelle Forest, in Central Highland of Ethiopia. Data were collected from a total of 50 quadrats of 20 m × 20 m (400 m2) at a distance of 100 m from each other using systematic random sampling techniques. In each quadrats, woody species of trees and shrubs with DBH > 2.5 cm and a height > 2 m of vegetation data were collected. For regeneration assessment density of seedlings and saplings of each species were recorded from five sub-quadrats of 5 m × 5 m (25 m2) demarcated at the four corners and one in the center. The general analysis of vegetation implied that the forest possesses the highest number of DBH, height, and density of species at the lower classes and the vertical stratification implied that most of the species in the Debelle Forest were found in the lower storey. Structural analysis of the Debelle natural forest indicated a density of 822.5 stems/ha and a total basal area of 58.68 m2/ha. The total density of seedlings, saplings, and trees was 1926.1, 1668.2, and 822.5 ha-1 respectively which shows an inverted J-shape pattern which is an indicator of healthy/good regeneration. To sustain the biological diversity of this particular forest, this study recommends the preservation of indigenous species, using both in-situ and ex-situ conservation and enrichment planting of economically valuable species.
Debelle forest • Regeneration status • Woody species • Structural distribution
The greatest East African Rift Valley bisects the Ethiopia plateau into western and eastern parts. The uplands and highlands west of the Rift Valley are collectively termed the North-Western Highlands and large massifs east of the Rift Valley are termed South-Eastern Highlands [1]. Ethiopia is a country considered highly diversified in physiographic, altitudinal, climatic, and edaphic with an extensive range of habitats and vegetation types which are rich in endemic flora and fauna. Most parts of the country consist of high plateaus and mountain ranges with precipitous edges dissected by numerous streams, which are tributaries of major rivers [2]. The floral diversity of Ethiopia ranked the country the fifth position largest in tropical Africa [3] which mainly is a result of altitudinal variations within Ethiopia produce a range of climates, which affect every aspect of life in the country; plant, and animal distribution, the concentration of people, and the types of agriculture; while temperature, rainfall, and vegetation play major roles in determining the distribution of fauna and flora including that of endemic mammals [4]. According to EFAP [5] reports, the altitudinal variation of the country ranges from the highest peak at Ras-Dashen, 4620 meters above sea level to the Afar Depression, which is 110 meters below sea level.
An extensive proportion of the Ethiopian highlands were once believed to have been covered by forests having wide coverage than at present, but have gradually declined [6]. Most of the remaining forests of the country are restricted to the southern and southwestern areas of the country [7]. The country's forest and woodland resources have been declining both in size (deforestation) and quality (degradation). Reports on the forest resources of Ethiopia are dominated by the alarming deforestation that goes on unabated and at an accelerating rate. There are many reasons for the destruction of natural forests some of them are agricultural expansion, uncontrolled exploitation for various purposes, notably for fuel wood charcoal, construction materials, etc., shifting cultivation, and forest fire [5] and which are intimately linked with the vicious cycle of mutually reinforcing factors, i.e., poverty, population growth and the state of the environment. The additional reason is an insufficient standard of forest management. Deforestation takes place in both natural forests and woodlands. It is recognized as the most severe environmental problem in Ethiopia.
Population structure is the distribution of individuals of each species to determine the overall regeneration profile of the forest vegetation based on the tree/shrub density, frequency, height, DBH, basal area, and important value index of the species [8]. Studies on the population structure and density of major canopy tree species can help to understand the status of regeneration of species as well as the management history and ecology of the forest [9]. The population structures of tree and shrub species information indicate the history of past disturbance to the species and environment and is used to forecast the future trend of a particular species that could provide information for conservation and management strategies [10,11].
Regeneration is a central component of forest ecosystem dynamics and the restoration of degraded forest lands. Whether or not the population has a stable distribution that allows continuous regeneration to take place has a significant contribution shown by plant population structure. If regeneration was taking place continuously, then the distribution of species cohorts would show a reverse J shape curve, which is an indicator of healthy/good regeneration [9]. As stated in Segawa P and Nkuutu DN [12] understanding the population structure of woody species and their natural regeneration status analysis of the forest resources is also convenient in identifying important elements of plant diversity, protecting threatened and economic species, and monitoring the status of the forest. Knowledge about the pattern of natural regeneration is important to answer the basic question of forest management [13].
Debelle Forest is one of the few remnant patches of humid forests found in the Central Highlands of Ethiopia. Although the forest is providing many economic and ecological benefits, it has been continuously exploited by surrounding communities for agricultural land, firewood collection, and charcoal production, and construction materials received little attention up to now. The vegetation has been severely and unwisely exploited by the local community. Conserving the remnant patches of Debelle forest species in the concrete ground before their whole elimination is undoubtedly a crucial task. The information on the population structure of woody plant species and their natural regeneration status analysis of the given forest provides a prerequisite for forest conservation and management and conservation strategies of biodiversity and its ecosystem services [12]. Studying forest resources is very important to fill knowledge and information gaps that deliver detailed information. Therefore, the present study attempts to offer information on the woody species’ vegetation structure and regeneration status of Debelle Forest.
Description of the study area
The study was conducted in Debelle Natural Forest which is located in Dire Enchini district, Oromia Regional State, Central Ethiopia at a distance of 40 km from the zonal capital city of Ambo in South West direction and 155 km from Addis Ababa, the capital city of the country, in the west direction. Geographically, it is situated between 08°44′50″N and 08º46′10″N latitude and 37º37′00″ and 37º38′20″E longitude (Figure 1). The District is bordered by Toke Kutaye District in the East and North, Jibat District in the West and South, and Amaya District in the south direction. The forest is located 10 km southwest of Enchini, the central town of Dire Enchini District, with an area of about 215 hectares. According to Ethiopian agro-climatic zonation [14] and Dire Enchini district Agricultural office data, the study area belongs to the humid and subhumid climatic zones. Its altitudinal range is between 2200 meters to the highest 3023 meters above sea level and the area receives a mean annual rainfall of 1400 mm [15]. The pattern of rainfall distribution is unimodal with a minimum annual rainfall of 1000 mm from March to May and a maximum of 1800 mm from June to August. The maximum and minimum annual temperature of the district ranges between 24 ℃ and 6 ℃ respectively. The topography of the District is a mountainous and sloping landscape with various physiographic features of landforms such as plateaus, hills, plains, and valleys.

Figure 1. The geographical location of the study area.
The District is characterized by three types of soil which are red soil (17%), Black soil (79%), and clay loam (4%) [16]. According to the Dire Enchini District Office of Agriculture and rural development, from the total of 38,687 ha of land in the District, the cultivation land covers about 47.03%, communal grazing land 32.4%, vegetation covers 8.67%, residential 4.3%, and others (including valleys, hills, wetlands, water bodies, and degraded lands) 7.6%. The farming system of the district is predominantly subsistence (99.04%) rainfed and 0.96% irrigation farming based on mixed crop-livestock production. Mixed farming is the major economic activity and it forms their livelihood at a subsistent level. Some of them also sell firewood and charcoal, especially in the surrounding Kebele to Enchini town (Figure 1).
Sampling design
Following a reconnaissance survey, vegetation data collection was carried out from February 05, 2020, to March 01, 2020. The woody species vegetation data on population structure and regeneration were collected by using systematic random sampling techniques following [17,18]. A total of six transect lines each with 200 m spacing were laid down along an altitudinal gradient from the bottom to the top of the forest. The initial transect was laid out randomly at one side of the forest along the gradient. The number of quadrats laid on each transect line may vary depending on the length of the transect lines which varies from 7 to 10.
Along each transect, a total of 50 quadrats of 20 m × 20 m (400 m2) were taken at a distance of 100 m from each other for vegetation data collection following the Braun-Blanquet approach of phytosociology as modified by Van der ME [19]. For assessment of the regeneration status of woody species, the density of seedlings and saplings of each species were counted and recorded from 5 m × 5 m (25 m2) sub-quadrats demarcated at the four corners and one in the center. The local name of each species and their growth habit was recorded in each sample plot during the fieldwork. Samples of all recorded woody plants were collected, pressed, dried, and brought to the National Herbarium of Addis Ababa University, for taxonomic identification. In addition to vegetation data, physiographic variables such as coordinate, altitude, longitude, latitude, and aspect were measured for each quadrat using geographical positioning system and compass.
Vegetation data collection method
Diameter at Breast Height (DBH) is the most common variable to measure tree size and can be a proxy of tree age. However, abundant studies use height class distribution, including seedlings and saplings, to determine the age or size structure of woody species [20,21]. Data on seedling and sapling density and size offers information on the distribution and regeneration status of the vegetation. In the 20 m × 20 m quadrats, all woody species of trees and shrubs in the sample plot with a DBH greater than 2.5cm were measured using a Caliper. The height of all woody species which is greater than 2 m was measured using a clinometer for taller trees and shrubs while seedling heights were measured with a ruler following [22], but visual estimates were used when the topography made it difficult to measure. Woody plant species with DBH < 2.5 cm and height < 1 m were recorded as seedlings while saplings were DBH < 2.5 cm and height of 1-2 m following [23]. Species density was calculated by converting the number counted from all quadrats into a hectare basis, and regeneration status was determined according to seedling and sapling densities [24].
Data analysis
Vegetation structure analysis: To analyze the vegetation structure of woody species, all individuals of each species encountered in the quadrat were grouped into diameter and height classes [25,26]. The table and histogram frequency were developed using the diameter and height classes vs. the number of individuals categorized in each of the classes. In each class, the percentage distribution of individuals was computed and presented in the table. The DBH structure was analyzed based on ten defined DBH classes (cm) following [27] [1=2.5-10cm; 2=10.1-20cm; 3=20.1-30cm; 4=30.1-40cm; 5=40.1-50cm; 6=50.1-60cm; 7=60.1-70cm; 8=70.1-80cm; 9=80.1-90cm; 10=>90.1cm] and the tree height was also categorized into seven height classes [1=2.0-5m, 2=5.1-10m, 3=10.1-15m, 4=15.1-20m, 5=20.1-25m, 6=25.1-30m, 7=>30m].
Data of individuals of woody species were grouped into height classes, to illustrate vertical structures of the forest. Three vegetation strata identified based on vertical strata were the upper, middle, and lower layers. According to Lamprecht H [28] individual trees with a height exceeds 2/3 of the top height are categorized as an upper layer, a tree height between 1/3 and 2/3 of the top height as the middle story, and the species with a height less than 1/3 of the top height is included in lower stratum. According to Kuma M and Shibru S [29] the structural parameters can be analyzed using the following formula:
Density: - is computed by converting the count from the total quadrats into a hectare basis.
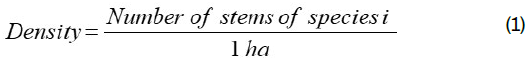
Frequency: - is calculated as the probability of finding species in a given quadrat area.

Basal Area: - Basal area was computed for the species with DBH >2.5 cm and calculated as
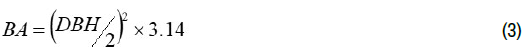
For all woody species with DBH > 2.5cm, the relative value of density, frequency, Dominance, and Importance Value Indices were calculated for each tree species using the following formula.
Relative density:
Relative frequency:

Relative dominance
The Importance Value Index (IVI) was calculated according to Phillips E [30] in which,

Regeneration status of the forest
As described in Siraj and Zhang the regeneration status of a given species in the forest can be analyzed by comparing the number of seedlings with saplings and saplings with matured tree data. The purpose of studying the regeneration status of spies is to enhance the future conservation priority of the forest. The regeneration status of species was determined based on the population size of seedlings and saplings. The regeneration status of the forest was assessed according to the categories used by. 1) if seedling > sapling > mature tree defined under “Good” regeneration; 2), if seedling > sapling < mature tree as “Fair” regeneration, 3) if a species survives only in the sapling stage, but not as seedlings (even though saplings may be less than, more than, or equal to mature) it is “Poor” regeneration, 4) if a species is absent both in sapling and seedling stages, but present as mature “None,” and it is categorized as “New,” if a species has no mature, but only sapling and/or seedling stages. For this study, woody plant species with DBH< 2.5 cm and height < 1m were considered seedlings, woody plants with height 1-2m were considered a sapling, and woody plants with height > 2 were considered trees/ shrubs [23].
Analysis of vegetation structure
The density of woody species : Tree density is a crucial parameter for sustainable forest management which is expressed as the number of trees per unit area. As described in, forest structure can be described in terms of tree density (stems ha-1), basal area (m2 ha-1), and size class distributions. In sampled quadrats of the forest, the total density of woody species with DBH greater than 2.5 cm in Debelle forest was 822.5 individuals ha-1 which is relatively higher than that other central highland Ethiopia forests like Washa forest, 698.8 stems ha-1; Munessa forest, 445 stems ha-1; Jibat Natural Forest was 720.3 individuals/ha; Kafta Sheraro National Park, 466 individuals ha-1. In another way, the density of the forest was low when it is compared with some other forests in Ethiopia such as the Chilimo forest: 3328.47 individuals’ ha−1; Sire Beggo: 1845 stems·ha−1, and Egdu (Menagesha Amba Mariam) forest which is 4362.08 stems per h. The density of the woody species varied significantly in the different forests. This could be attributed to variations in topographic gradients and habitat preferences of species forming the forest, and the degree of anthropogenic disturbances. The density of the desired species was reduced due to the devastating effects and lack of afforestation.
The data analysis of Debelle forest woody plant species showed that six species contributed to the largest proportion of 42.13% of the total density in the forest. Of these woody species, Cupressus lusitanica was the dominant species in the forest comprising 67.5 individual’s ha-1 (8.21%) followed by Ilex mitis 65 individual’s ha-1 (7.9%), Bersama abyssinica 57.5 individual’s ha-1 (6.99%), Prunus africana 55.5 individual’s ha-1 (6.75%), Brucea antidysenterica 52.5 individual’s ha-1 (6.38%), and Pittosporum viridiflorum 48.5 individual’s ha-1 (5.9%). On the other hand, the remaining 69 species together contributed 952 (57.87%) of total density (Table 1).
| S/N | Species | No of Matured Species | Density | % Cover |
|---|---|---|---|---|
| 1 | C. lusitanica | 135 | 67.5 | 8.21 |
| 2 | I. mitis | 130 | 65 | 7.90 |
| 3 | B. abyssinica | 115 | 57.5 | 6.99 |
| 4 | P. africana | 111 | 55.5 | 6.75 |
| 5 | B. antidysenterica | 105 | 52.5 | 6.38 |
| 6 | P. viridiflorum | 97 | 48.5 | 5.90 |
| 7 | Other 69 species | 952 | 476 | 57.87 |
| Total | 1645 | 822.5 | 100 |
According to the data analysis the density of tree individuals in Debelle forest with DBH greater than 2.5cm was 279 individuals per hectare, those with greater than 10 cm were 182.5 individuals per hectare and those greater than 20cm were 361 individuals per hectare. The ratio of tree density with DBH > 10cm (a) to DBH > 20cm (b) for the Debelle forest is 0.51. When comparing the ratio (a/b DBH) of the Debelle forest to the other remnant patch of forests in central Ethiopia, the forest is lower than that of the Gedo forest which is 1.79 and Chilimo forest which is 2.6, but has a relatively similar ratio with Egdu (Menagesha Amba Mariam) the forest which is and Jibat which is 0.56. This shows that there is a predominance of large-sized individuals in the study forest. This is because small-sized individuals are affected by grazing animals, firewood collection, and fencing by communities.
Diameter at breast height (dbh) distribution
The DBH of all woody tree species recorded in the study area was classified into ten DBH classes: 1= 2.5-10cm; 2= 10.1-20cm; 3= 20.1-30cm; 4=30.1-40cm; 5= 40.1-50cm; 6=50.1-60cm; 7= 60.1-70cm; 8= 70.1-80cm; 9= 80.1-90cm; 10= >90.1cm). According to Table 2 below most woody tree species were distributed in the 1st and 2nd classes with 299.5 (36.41%) and 167(20.3%) individuals ha-1 respectively. The distribution of trees in DBH class three was 92.5 individuals ha-1 (11.25%) and 100.5 ha-1 (12.22%), 67 ha-1 (8.15%), 54.5 ha-1 (6.63%), 22 ha-1 (2.67%), 9.5 ha-1 (1.16%), 8 ha-1 (0.97%) and 2 ha-1 (0.24%) in DBH class 4-10 respectively. Most individuals that contributed to the lower DBH class were A. macrobotrys, B. abyssinica, B. antidysenterica, C. lusitanica, J. procera, P. africana, and O. capensis. The middle DBH classes were dominated by A. abyssinicus, A. dimidiate, H. quartinianum, M. salicifolia, O. europaea, S. abyssinica including some of the lower class mentioned above. High DBH density was contributed by I. mitis, H. abyssinica, E. capensis, P. falcatus, and P. viridiflorum. The individual density distribution of woody species exhibited decreasing from lower to higher DBH classes. Most of the species had the highest number of individuals in the lowest DBH class and proceeded with decreasing degrees to the consecutive higher DBH classes (Table 2).
| Class | DBH Class | Density | Density/ha | Percentage (%) |
|---|---|---|---|---|
| 1 | 2.5-10 | 599 | 299.5 | 36.41 |
| 2 | 10.1-20 | 334 | 167 | 20.30 |
| 3 | 20.1-30 | 185 | 92.5 | 11.25 |
| 4 | 30.1-40 | 201 | 100.5 | 12.22 |
| 5 | 40.1-50 | 134 | 67 | 8.15 |
| 6 | 50.1-60 | 109 | 54.5 | 6.63 |
| 7 | 60.1-70 | 44 | 22 | 2.67 |
| 8 | 70.1-80 | 19 | 9.5 | 1.16 |
| 9 | 80.1-90 | 16 | 8 | 0.97 |
| 10 | >90.1 | 4 | 2 | 0.24 |
| Total | 1645 | 822.5 | 100 | |
The diameter class distribution pattern shows the general trends of population dynamics and recruitment progresses of a particular species. As indicated in Table 2, fifty-six percent of individuals were distributed in the 1st and 2nd classes. The general pattern of DBH class distribution of woody plant species in the study area showed normal DBH distribution when viewed from the whole set of the plant community, confirming an inverted J-shape, which indicated good reproduction and recruitment potential of the forest Figure 2. This fosters the nearly normal inverted J-shaped curve, which revealed that the highest number of species frequently occurred in the lower diameter class and a gradual decrease towards the higher classes. The results of this may not define the trends of population dynamics and the recruitment process of individual tree species. A similar result with an inverted J-shaped curve DBH distribution was reported from Sesa Mariam Monastery Forest and Aba Asrat Monastery.

Figure 2. General DBH distribution patterns of Debelle forest with their percentage cover.
The DBH Class of some selected woody species having a higher importance value index was analyzed to predict the future of these individuals, in which the selected tree species exhibited various distributions in Figure 3. The analysis of five selected tree species with higher IVI from the study area revealed various patterns (Figure 3). The first pattern of population structure was a Zigzag or irregular distribution pattern. It is a type of distribution of individuals in which unpredictable patterns of distribution of individuals were observed. The density of all individuals in the group decreases with increasing DBH up to some points and then increases with increased DBH in a zigzag pattern. The pattern continues to decrease with increasing DBH and then increase with increasing DBH up to some points and finally, ends with decreasing density of individuals as DBH class increases. Ilex mitis, Prunus africana, and Hagenia abyssinica belonged to this group Figure 3 A, B and C.
The second pattern is shown by bell shape distribution in which the number of individuals in the middle diameter classes is high, and low in lower and higher diameter classes. E. capensis belonged to this group (Figure 3D). The third pattern was represented by P. viridiflorum (Figure 3E), which reveals a higher number of individuals in the first diameter class and decreases with increasing DBH up to some points and then increases with increased DBH class. Finally, the density of the species declined to zero in the higher DBH class. The important information for forest management and conservation could be given through analysis of the population structure for each tree and shrub species [22]. The population structures of trees have significant implications for their management, sustainable use, and conservation strategies [8]. Population pattern is helpful to understand the population density, regeneration, and recruitment status of particular vegetation [10].

Figure 3.The pattern of distribution of selected woody species. (DBH Class 1=2.5-10cm, 2=10.1-20cm, 3=20.1-30cm, 4=30.1-40cm, 5=40.1-50cm, 6=50.1-60cm, 7= 60.1-70cm, 8=70.1-80cm, 9=80.1-90cm, 10= >90.1cm).
From the analysis of the population dynamics structures analysis of selected representative species results, it was observed that there were certainly missed out individuals at different diameter classes. The complete absence of individuals in some diameter classes suggests that the regeneration of species was hindered during one or several phases of their life cycle. These might be caused by trampling by livestock, selective cutting for construction or firewood, and conventional fire in the forest, which is the common practice in the study area. In addition, in some cases the highest DBH class was not represented by individuals of species indicating that the vegetation was dominated by shrubby species or did not reach full maturity, i.e., in most cases succession was not complete. Some species displayed variations of the above patterns and others has no defined patterns of frequency distribution in their diameter classes. Generally, such variations in the population structure of woody species may be due to environmental factors that can influence their regeneration, dissimilarities in the regeneration performance of the species, human interference, and change in other natural and artificial factors (Figures 2 and 3).
Tree height distribution and vertical structure
Individual woody plant species recorded in the study area were categorized into seven height classes. 1)2.0-5m, 2)5.1-10m, 3)10.1-15m, 4)15.1-20m, 5)20.1-25m, 6)25.1-30m, 7)>30m. According to data analysis indicated in Table 3, there is a higher number of woody plant species in the first height class (2.0-5 m) with 295.5 (35.93%) individuals per hectare, and the second height classes (5.1-10m) which have 216.5 (26.32%) individuals per hectare. The density of trees in height class three (10.1-15m) was 150 ha-1 with 18.24% and 87 ha-1 (10.58%), 55.5 ha-1 (6.75%), 16.5 ha-1 (2.01%) and 1.5 ha-1 (0.18%) in height class 4(15.1-20m), 5(20.1-25m), 6(25.1-30m) and 7(>30m) respectively. The density of trees became decreased with increasing height classes which implies, there is a higher number of individuals in the lower size class and a gradual decrease towards the middle and upper size trees. The general pattern of height class distribution showed distinct inverted J-shaped curves, showing that the forest was dominated by lower-stature individuals (Table 3).
| Class | Height Class (m) | Density | Density/ha | Percentage (%) |
|---|---|---|---|---|
| 1 | 2.0-5 | 591 | 295.5 | 35.93 |
| 2 | 5.1-10 | 433 | 216.5 | 26.32 |
| 3 | 10.1-15 | 300 | 150 | 18.24 |
| 4 | 15.1-20 | 174 | 87 | 10.58 |
| 5 | 20.1-25 | 111 | 55.5 | 6.75 |
| 6 | 25.1-30 | 33 | 16.5 | 2.01 |
| 7 | > 30 | 3 | 1.5 | 0.18 |
| Total | 1645 | 822.5 | 100.00 |
The variation in tree height is an important ecological phenomenon that influences the microclimate and distribution of epiphytes and climbers. As it is described in many studies, the analysis of population structures for each tree and shrub species could give more accurate and distinct information for forest management and conservation activities than a general description of forest structure [22].
The vertical structure of trees in Debelle Forest was defined following the International Union for Forestry Research Organization (IUFRO) classification scheme. According to this scheme, forest vegetation was divided into three vertical layers which include; upper, middle, and lower stories. Individual trees with a height exceeding 2/3 of the top height are categorized as an upper layer while the middle story includes having a height between 1/3 and 2/3 of the top height and the lower stratum is species with a height less than 1/3 of the top height. Each tree is categorized into one of the tree stories based on its height. The tallest trees observed in Debelle Forest were H. abyssinica and E. capensis with 32 m height tall in quadrants 2 and 44 respectively. Based on this, trees in the top height, middle, and lower height bands were those in the height range of >21.3 m, 10.6-21.3 m, and <10.6 m respectively. The result of this study indicated that the highest species density was concentrated in the lower storey 512.5 stems ha-1 which accounted for 62.31% was found in the lower storey followed by the middle (30.64%) and upper storey (7.05%) respectively. The total height of the Debelle forest is summarized into three layers (story) as shown in Table 4 below.
| Storey | Density/ha(A) | Density % | Species No.(B) | Species % | The ratio of A to B |
|---|---|---|---|---|---|
| Lower | 512.5 | 62.31 | 71 | 94.67 | 7.2:1 |
| Middle | 252 | 30.64 | 30 | 40 | 8.4:1 |
| Upper | 58 | 7.05 | 10 | 13.33 | 5.8:1 |
According to the result of the study obtained from Debelle forest, about 71 woody species were found in the lower storey (94.67%), and about 30 woody species were found (40%) in the middle storey, while the upper storey was occupied by 10 species of which 13.33%. The upper story is mostly occupied by woody species like P. africana, I. mitis, H. abyssinica, and E. capensis. In most of these forests, the middle storey is dominated by species like C. lusitanica, E. capensis, J. procera, and P. viridiflorum. The lower storey of the forests is largely composed of small trees and shrubs such as B. antidysenterica, B. abyssinica, H. quartinianum, and C. lusitanica. Many authors such as described related results from other forests in Ethiopia. Many species couldn’t attain the higher and the middle storey due to their nature of growth habit. The species that appeared in both the middle and lower strata also have a representative in the upper strata. Most of these trees have started dying back from their tips and degenerating and some of them are completely absent.
Basal area
The total basal area of trees/ shrubs species having DBH > 2.5 cm in the Debelle forest was 58.68 m2 ha-1. The highest basal area contribution for the forest is by P. africana with 9.45 m2 ha-1 (16.14%) followed by I. mitis with 9.2 m2 ha-1 (15.7%), H. abyssinica 7.81 m2 ha-1 (13.33%), E. capensis 7.58 m2 ha-1 (12.93%), P. viridiflorum 4.77 m2 ha-1 (8.15%), O. capensis 4.02 m2ha-1 (6.86%), M. salicifolia 2.91 m2 ha-1 (4.96%), Juniperus procera 2.17 m2 ha-1 (3.70%), A. dimidiata 1.45 m2 ha-1 (2.48%) and C. lusitanica 1.33 m2 ha-1 (2.27%). The remaining 65 species contributed about 7.9 m2 ha-1 (13.48%) of the total basal area. On the other hand, the lowest (below 0.05 m2 ha-1) was recorded for most species like E. brucei, O. urticifolium, V. amygdalina, and B. polystachya. When we compare the basal area of the Debelle Natural forest with some other vegetation of the country it was lower than that of the Dodola forest, Boda forest, Kimphe Lafa Berbere forest, Menagesha Amba Mariam and Jibat forest but higher than the Munessa forest, Dindin forest, Menagesha –Suba forest, Gedo and Chilimo forest.
The species with the largest basal area are the most important in the study forest. The overall dominance of species of the forest described by the combination of high density and high frequency coupled with high basal area indicates [28]. As indicated in Shiferaw Belachew, the basal area gives a better measure of the relative importance of the species than stem count. From this study, it can be concluded that basal area does not depend on the number of species but rather on the size of the species.
Frequency
Frequency is the number of sample plots in which a given species occurred in the study area and gives an approximate indication for homogeneity and heterogeneity of vegetation. H. abyssinica, I. mitis and P. africana were the three most frequently observed species each with 68% of occurrence and 5.79% relative frequency while C. lusitanica and P. viridiflorum were the fourth and the fifth each with 58% occurrence and 4.94% relative frequency respectively. Depending on the percentage frequency values, the woody plant species were classified into the following five frequency classes: 1) 0-20, 2) 21-40, 3) 41- 60, 4) 61-80, and 5) 81-100 which is expressed in percentage.
According to Figure 4, there is no distribution of species in frequency class five, and 4% of species are distributed in frequency class four. The remaining species were distributed in frequency classes three, two, and one containing 12%, 2.67%, and 81.33% respectively. Few woody species have the highest frequency value which shows that these species are relatively recorded from most sample plots and are well distributed in the vegetation. The figure also displays that there are higher numbers of species distribution in lower frequency classes and no number of species in the highest frequency classes which confirms that there is a high degree of floristic heterogeneity in Debelle Forest (Figure 4).

Figure 4. Frequency distribution of woody plant species in Debelle forest.
Importance Value Index (IVI)
The structural importance of the tree species relative to other species that exist in the forest is indicated by Important Value Index which is calculated from the combination of three parameters including Relative Frequency, Relative Density, and Relative dominance [18]. I. mitis (29.37%), P. africana (28.65%), H. abyssinica (23.78%), E. capensis (22.33%) and P. viridiflorum (18.97%) were the top five most dominant tree species of the study area and they contributed about 41.03% of total important value index. Depending on their IVI values, these species are considered ecologically most significant in Debelle Forest relative to other species. The result indicates that much of IVI was occupied by a few species. P. stellatum, S. ellipticum, and R. staddo are species among the lowest relative IVI values and were found to be the least dominant species in the study area (Table 5).
| Species | RF | RD | RDO | IVI | IVI % |
|---|---|---|---|---|---|
| I. mitis | 5.79 | 7.90 | 15.67 | 29.37 | 9.79 |
| P. africana | 5.79 | 6.75 | 16.11 | 28.65 | 9.55 |
| H. abyssinica | 5.79 | 4.68 | 13.31 | 23.78 | 7.93 |
| E. capensis | 4.43 | 4.98 | 12.91 | 22.33 | 7.44 |
| P. viridiflorum | 4.94 | 5.90 | 8.13 | 18.97 | 6.32 |
| O. capensis | 4.43 | 4.68 | 6.85 | 15.96 | 5.32 |
| C. lusitanica | 4.94 | 8.21 | 2.26 | 15.41 | 5.14 |
| M. salicifolia | 4.43 | 4.56 | 4.95 | 13.94 | 4.65 |
| J. procera | 4.26 | 4.86 | 3.70 | 12.82 | 4.27 |
| B. abyssinica | 4.09 | 6.99 | 0.32 | 11.40 | 3.80 |
| B. antidysenterica | 4.09 | 6.38 | 0.83 | 11.30 | 3.77 |
| H. quartinianum | 3.58 | 3.59 | 0.89 | 8.05 | 2.68 |
| O. europaea | 3.07 | 2.43 | 1.60 | 7.10 | 2.37 |
| A. dimidiata | 1.70 | 1.22 | 2.48 | 5.39 | 1.80 |
| A. macrobotrys | 2.21 | 1.22 | 0.67 | 4.10 | 1.37 |
| P. schimperi | 1.70 | 1.34 | 0.20 | 3.24 | 1.08 |
| E. arboria | 1.53 | 1.52 | 0.15 | 3.21 | 1.07 |
| A. abyssinicus | 1.36 | 0.79 | 1.00 | 3.15 | 1.05 |
| S. abyssinica | 1.02 | 0.91 | 1.16 | 3.10 | 1.03 |
| G. robusta | 0.85 | 1.34 | 0.39 | 2.58 | 0.86 |
| E. globulus | 1.02 | 1.34 | 0.19 | 2.55 | 0.85 |
| P. patula | 0.85 | 0.73 | 0.67 | 2.25 | 0.75 |
| E. camaldulensis | 0.85 | 1.16 | 0.21 | 2.22 | 0.74 |
| R. abyssinica | 1.19 | 0.91 | 0.10 | 2.20 | 0.73 |
| S. myrtina | 1.02 | 0.97 | 0.19 | 2.18 | 0.73 |
| F. indica | 1.19 | 0.73 | 0.20 | 2.12 | 0.71 |
| P. falcatus | 0.85 | 0.30 | 0.93 | 2.08 | 0.69 |
| Other 48 species | 23.00 | 13.62 | 3.93 | 40.55 | 13.52 |
| Total | 100.00 | 100.00 | 100.00 | 300.00 | 100.00 |
Species with lower importance value indexes need high conservation priority while those that exhibited higher importance value indexes need high monitoring and management. Based on this, the species that have higher IVI values in Debelle Forest including I. mitis, P. africana, H. abyssinica, E. capensis and P. viridiflorum (Table 5) require continuous monitoring while tree species with lower IVI values that considered to be threatened in Ethiopia and also found at risk of local extinction requires immediate protection and conservation efforts such as assisting their natural regeneration. The rest species that are found in intermediate priority classes also require an intermediate conservation program and follow-up. As it is stated by Mohammed and Teshome, the most dominant and ecologically important species might also withstand pathogens, regenerated successfully, grow under shade, and in competition with other species, least chosen by browsing animals, attracted by pollinators and seed predators that assist seed dispersal within the existing environmental conditions in their respective area [30].
Regeneration status of debelle forest
The potential regenerative status of individual species in space and time within a forest stand determines the future composition of the forests and is measured by the density values of seedlings and saplings of the species. The presence of a sufficient number of young trees, saplings, and seedlings in the population is very important for the successful regeneration of a given forest. The average density of seedlings, saplings, and woody tree species in the Debelle forest were 1926.1 (43%), 1668.2 (38%), and 822.5 (19%) ha−1, respectively. This result shows that the species is categorized under good regeneration status. The ratio of seedlings to saplings was 1.15, saplings to mature trees 2.03, and seedlings to mature trees was 2.34 which indicates that the distribution of seedling density is higher than both sapling and mature tree/shrub (i.e. seedlings > saplings > mature trees). Therefore, there is a sufficient amount of seedlings and saplings exist as a potential for regeneration and recruitment in this study (Figure 5).

Figure 5. Woody plant species regeneration status in Debelle forest.
According to and, classification ways the regeneration status of woody plants in the Debelle forest revealed that 27 (34%) of trees/shrubs species showed “good” regeneration status, 21 (26%) displayed “fair” regeneration condition, 16 (20%) showed “poor” regeneration status, 11 (14%) were “not regenerating” at all, and 5 (6%) were presented only in a sapling or seedling stage as new species regenerating in the study area (Figure 5). But as stated above, “poor” and “not regenerating” status shares about 30% of trees/shrubs species in the area. The probable reason for this condition may be due to existing disturbances in the study site such as overgrazing, firewood collection, and poor biotic potential of tree species. Good regeneration was more common for less valuable trees/shrubs than for species with high importance values, revealing discontinuous recruitment due to selective cutting of middle and higher DBH classes. Species that have economic, medicinal, and/or ecological values, showed poor regeneration. This is because most trees are over-mature and not producing seeds, as well as unfavorable environmental conditions in the Debelle forest. In the study area, some of the woody species were recorded as new. These new regenerating species may have colonized the study site through different mechanisms such as dispersal of seeds through the drooping of birds and animals. In the study site, the species like C. tomentosa, C. africana, S. rhombifolia, A. africanus, and M. obscura were the newly regenerated woody species. Additionally, individuals in the young stages of any species are more vulnerable to any kind of environmental stress and anthropogenic disturbance. Therefore, such human-induced activity may change the future structure and composition of the Debelle forest.
In conclusion, the present study has provided valuable information on the Debelle forest which can be used as baseline information on the structure and regeneration status of woody plant studies. From the structural analysis, the total density and basal area of woody plant species having DBH > 2.5 cm were 822.5 individuals and 58.68 m2 per hectare. Density ha-1, height, and frequency of the woody species were more concentrated in the lower DBH size class. The general pattern of DBH and Height class distribution of woody plant species showed distinct inverted J-shaped curves, which indicated good reproduction and recruitment potential of the forest. The vertical structure of trees revealed that the highest species density was concentrated in the lower storey followed by the middle and upper storey. Some economically and ecologically important species had population structures that showed abnormal recruitment patterns with poor reproduction patterns which requires optimal regeneration that assures the sustainable use of these species at present and in the future. The Debelle forest regeneration status shows that the species is categorized under good regeneration status at the community level. Analysis of woody species regeneration revealed that most of the tree species are available in the seedling and sapling stage in the forest; some are without sapling and/ or seedling stage; while others are represented by all stages (seedling, sapling, and mature) and few are not represented in seedling and sapling stage. Therefore, to sustain the biological diversity of this particular forest, this study recommends the preservation of indigenous species, especially those with “Poor” and “None” regeneration status using both in-situ and ex-situ conservation and enrichment planting of economically valuable species. It is essential to develop and implement effective forest conservation measures to sustainably use biodiversity resources and priority should be given to species with low IVI values in conservation activities and management programs of the forest. Future research directions and recommendations are forwarded for the sustainable utilization of the Debelle Forest natural resources.
I am extremely thankful to Beijing Forestry University for providing me with Postgraduate study in China and Hawassa Agricultural Research Center for Research financial support. Finally, I am grateful to acknowledge the Dire Enchini Agricultural extension developmental agents for their continuous monitoring of the beneficiaries.
Google Scholar, Crossref, Indexed at
Google Scholar, Crossref, Indexed at
Google Scholar, Crossref, Indexed at
Journal of Biodiversity & Endangered Species received 624 citations as per Google Scholar report