Research - (2022) Volume 13, Issue 3
Received: 01-Feb-2022, Manuscript No. bej-22-53067;
Editor assigned: 03-Feb-2022, Pre QC No. P-53067;
Reviewed: 14-Feb-2022, QC No. Q-53067;
Revised: 20-Feb-2022, Manuscript No. R-53067;
Published:
27-Feb-2022
, DOI: 10.37421/2151-6219.2022.13.373
Citation: Birara, Mulugeta Belayneh. “The Effect of Service Quality on Customer Satisfaction: The Case of Medium Level Hotels in Debre Markos Town.” Bus Econ J 13 (2022): 373.
Copyright: © 2022 Birara MB. This is an open-access article distributed under the terms of the Creative Commons Attribution License, which permits unrestricted use, distribution, and reproduction in any medium, provided the original author and source are credited.
The aim of this study was to identify the effect of service quality dimensions on customer satisfaction in medium level hotels of Debre Markos town. In this study, the customers’ perceptions of the seven service quality dimensions were examined to determine the level of customers’ satisfaction of hotels. To achieve the objectives of this study, the data were collected through standardized close ended questionnaire from a sample of 5 hotels out of the total of 15 medium level hotels in Debre Markos town. In order to select the sample size of hotels, the researcher used simple random sampling techniques using lottery method on account of the hotels’ homogenous characteristics. The data was collected from 305 respondents using self- administered questionnaires and the respondents were selected using convenience sampling method that was available to the researcher by virtue of its accessibility. The final response rate was 80?, and based on this, the analysis was made. In this study, both descriptive and explanatory research design was used. Descriptive statistical tools such as (frequency, mean, standard deviation) and inferential statistics (correlation and multiple linear regression analysis) were used by applying SERVPERF model. The result of this study indicates that the five service quality dimensions (tangibility, assurance, responsiveness, core hotel benefits and corporate image) have positive and significant relationship with customer satisfaction except empathy and reliability. Based on the findings, the researcher recommended that hotels should hire self-motivated, enthusiastic employees who are capable of handling customers and solve complaints in an effective manner, provide continuous training to the employees on ways of rendering service in hotels, give due attention for their employees by providing the required uniforms, develop their core competencies and prepare service quality standard plans.
Service quality • Customer satisfaction • Perception • SERVPERF
Background of the study
The dynamic environment makes business organizations compete each other for their survival. Demands from customers, technological development, change of value and globalization are factors that drive the need to change as well as to develop an organization and to be competent, organizations should have standardized quality on their product or service [1,2]. Identified, quality is defined as a combination of features based on the ability to meet the possible requirements of a product or service. There is another concept together with quality i.e., service quality. It is described as the comparison of service expectations of customers with the actual performance. Service quality is crucial to the success of any service organization and customers have an access to interact closely with various aspects of a given organization because they participate in delivery and consumption of services [3]. They also found that their awareness about the service gives them the opportunity to assess the service delivery of organizations. In addition, they identified that customers know the service quality by comparing what they have received with their desired service.
According to Anantharanthan Parasuraman, Zeithaml, & Berry, 1985, service quality is significant predictor of customer satisfaction by using SERVQUAL instrument, and service quality and customer satisfaction have been identified as key elements of the service profit chain. Hence, service quality has a great value for the organization’s success and competitive advantage. Now a day’s quality in products and services is the main issue for all organizations in this dynamic environment. Quality of the product can be measured by marketers but measuring the quality of service is impossible or complex because it does not have clear and measurable parameters [4].
The competency and profitability of organizations becomes high if they set high standard service quality to make customers satisfy and make them to be loyal for a long period of time. Thus, from the findings of Newman K and Cowling A [5], one can understand that if service quality is poor, the organizations do not survive and be profitable. As the service organization, hotels start to place importance on service quality on their products and service in and They also understood that hotels serve as a home for travelers and when the first roads were built in Britain, journey to the various parts of the world were begun. As their findings, travelers were going to different places, foods; shelter and drink were to be found in road side taverns and later on monasteries started to provide hospitality to get money for the church.
According to Honok findings, the first publicly held hotel was established in 1792 and the first modern hotel was opened in New York in 1809. In addition, he found that the first business hotel (Buffalo statler) was opened in Boston in 1908. Another researcher also identified that now a day tourism is increasing at alarming rate so that visitors want to get high quality service that help hotels compete each other to have high market share. In Ethiopia, the first hotel was established in the name of Itege Taitu in Addis Ababa in 1898 E.C and the hotel was opened to provide guests a place to rest and dine. It is also used to provide amenities including a Varity of bed rooms, bar and restaurant service, live jazz music every night, laundry and more service make it preferable by customers (Ministry of culture and tourism report, 2006).
A decade ago, Debre Markos town was not as such attractive as similar towns of Ethiopia. Its development was started with the establishment of institutions such as colleges, university, health centers, primary and secondary schools, churches and mosques, and infrastructures (roads, waters and electric powers). In addition, with the increasing number of residents and beginning of exhibitions, so many investors invest their capital on the buildings of hotels so as to deliver service for the customers as well as for their economic growth. Among the main hotels which were established were Shebele, Gozamen, Tilik, Nubeya, FM, Ethiopia, paradise, Enemay and the like. All hotels are below the standards which were set internationally; they are simply classified in to medium level and lower level in accordance with the prevailing conditions of the area (Office of culture and Tourism annual report, 2015).
To be medium level, hotels should have a building, reception departments and bed rooms with the criterion below:
A building should have: Main gate for the guests only, and the other gates for the employees’ and delivery of goods and properties, conducive environment for trading activities, gate and parks for Vehicles.
A reception department should have: Employees with neat uniforms, registration books for guests, wall watch, place for hanging of bed rooms’ keys, receipt for bed rooms, attractive ceiling and quality cement screed floor, menu for foods and bedrooms, chairs and tables for guests, indicators of bed room numbers, stamp of the organization, latrines for male and female guests.
A bed room should have: Neat mattress which have minimum thickness of 12 cm with comfort pillows, ten and above beds with a width of 8 m2 each, quality blanket, identity number, well organized electric installation, at least one chair, table, coat hanger, bottles, and glass of water, one hand washes room for five bed rooms, latrines and bath rooms of males and females for five bedrooms.
Now a day’s hotels start to render unique service which is slightly different from the others in order to attract customers and achieve their objectives and goals so that service quality becomes gradually changing even though it is not as intended [6]. Hence, this research will try to assess the effect of service quality on customer satisfaction in medium level hotels in Debre Markos Town.
Statement of the problem
The hotel industry can make an economy strong and bring development for a given country. Regarding the service delivery of hotels, different researchers had identified problems in accordance with their study areas so that to show the service related troubles of hotels, the researcher explained as shown below. The hotel industry is faced with lack of reliability, empathy and assurance and low responsiveness to customer requests [7]. Found that many hotels may not be able to achieve quality due to competition in the industry and failure to address all the service quality dimensions.
Hotel industries in Sir Lanka had various problems while they are rendering service to customers such as employees were impolite, did not quickly apologize when they made mistakes in the service, and did not listen carefully when customers’ complain [8]. According to Bashirian and Majdpuor, developing service quality standards and sustaining the service level as well as lack of creating positive image in the minds of customers through a standardized service are the major challenges of hotel industries in Iran. Moreover, hotels lack attractive tangible parts including the appearance of physical facilities and also staffs are in efficient on their knowledge and courtesy to create trust and confidence to the guests.
Hotels try to satisfy their customers as much as possible but they are still facing problems because of the dynamic demand of guests and difficulty of measuring and managing the service provision properly [9,10]. According to Abrham 2015 findings, the service provided by hotel industries has so many problems even if great attention is given for the expansion of the sector and the current situation in hotels of Addis Ababa city is simply gathering money without improving their service delivery. In addition, employees waste much time while they were ordered with guests and also lack ethics of hotels. Another researcher Buzeye also conducted a comparative research on star hotels in Addis Ababa and found that handling of customers in Ethiopia is still traditional and the service provision technique is non- scientific. For instance, employees of the hotel sometimes insult the customers, cheat the guest, chewing gum while serving the guests and touching their hair and other bodies etc. As his findings, tourists are forced to come to Ethiopia in three cases. First since Ethiopia has natural and manmade recreational areas like religious institutions (Churches and Mosques), they are interested to visit it. Secondly, there are continental and international hotels to host conferences of various issues. The third reason is because of its security or being free from terrorist acts, that helps it steadily grow despite the effect of the global financial crisis. According to Mesfin hotel industry has been starting growing but the quality of service given by them is still traditional because there is no fast and active service provided by hotels instead there is wastage of time while they are rendering service for the guests that make them dissatisfied and cerate negative image on hotels. Similarly, in some hotels of Debre Markos town, so many problems are seen with related to service delivery of hotels. Among those problems which could be hindrance to provide quality service are: - lack of neatness of employees, uniforms and physical features of hotels, untrained employees, low consciousness and attitudes of employees towards service delivery. When the employees are giving service to guests, they don’t consider them as the main source of income and guaranty for the existence of hotels. In addition, since there is no competition among hotels or no hotels use a given hotel as bench mark to improve their service delivery in this dynamic environment, they are still working in a traditional way even if some enhancement is observed especially in medium level hotels.
As discussed above, different researchers conducted their study on the relationship between the five service quality dimensions/ tangibility, reliability, empathy, assurance and responsiveness/ and customer satisfaction in stars hotels in foreign countries and in Ethiopia instead of examining hotels which have no levels of stars. The other reality that the researcher observed is that most of the urban populations of Ethiopia in the present time are users of medium level hotels rather than stars hotels on account of their purchasing power and other factors. Therefore, the researcher is motivated to conduct the study on medium level hotels in Debre Markos town with the common five dimensions of service quality (tangibility, reliability, responsiveness, assurance, and empathy) and added two additional dimensions of service quality/corporate image and hotel benefits/ to address the issues by stating the problem as “the effect of service quality on customer satisfaction” using the SERVPERF model. In line with this, the study attempts to answer the following research questions.
• What is the correlation between service quality dimensions /tangibility, reliability, responsiveness, empathy, assurance, corporate image and core hotel benefits) and customer satisfaction?
• What is the perception of customers on service quality dimensions?
• Which dimensions are the best predictors of overall service quality?
Objective of the study
General objective: The general objective of the study is to identify the effect of service quality dimensions on customer satisfaction in medium level hotels in Debre Markos Town, Ethiopia.
Specific objectives:
● To find out the effect of tangibility on customer satisfaction in hotels.
● To examine the effect of reliability on customer satisfaction in hotels.
● To assess the effect of responsiveness on customer satisfaction in hotels.
● To determine the effect of assurance on customer satisfaction in hotels.
● To ascertain the effect of empathy on customer satisfaction in hotels.
● To examine the effect of corporate image on customer satisfaction in hotels.
● To identify the effect of core hotel benefits on customer satisfaction in hotels.
Significance of the study: The hotels will use it to design their strategies to create their reputations and evaluate the strength and weakness as well as the opportunities and threats of the business environment. It also enables hotels to take recommendations and suggestions from their guests about their service quality and give more training for their employees and develop their service quality standards. It can also use as a stepping stone for the future researchers who want to conduct in this area.
Scope of the study: Although the topic can be viewed with all service organizations, the scope of the study was delimited on identifying the effects of service quality on customer satisfaction in medium level hotels in Debre Markos Town. Since there are no stars hotels in the town, the research was conducted on medium levels hotels and it is conducted only with seven service quality dimensions/tangibility, reliability, responsiveness, empathy, assurance core hotel benefits and corporate image/.
Conceptual framework
The aim of this section is to summarize the idea about past literature and to bring about the contributions for this study. After the literature has been reviewed, the relationship between service quality dimensions and customer satisfaction are discussed below.
Researches were conducted by using ten service quality dimensions (tangibility, reliability, responsiveness communication, access, competence, courtesy, credibility, security and knowledge) on customer satisfaction by Later he conducted the research on the relationship between service quality dimensions and customer satisfaction and refined the ten dimensions into five dimensions (tangibility, reliability, responsiveness, assurance and empathy) because he got the appropriateness of the five service quality dimensions to measure customer satisfaction in various service organizations.
On the other hand, even if purified the ten dimensions into five dimensions, improved and developed the service quality dimensions into seven dimensions. These are: - tangibility, reliability, responsiveness, assurance, empathy, technical and corporate image. Moreover, another researcher as cited added two service quality dimensions/ core hotel benefits and hotel technologies/ on the five service quality dimensions/ tangibility, reliability, responsiveness, empathy, and assurance [11].
Thus, the researcher took the six dimensions (tangibility, reliability, responsiveness, assurance, empathy and corporate image) from and added core hotel benefits. The reason why these two additional dimensions of service quality used in this study was that the researcher wants to identify the effect of these dimensions on customer satisfaction and to fill the gap which was not seen by other researchers (Figure 1).

Figure 1. Conceptual frame work of service quality dimensions on customer satisfaction.
Hypothesis
H1: Tangibility has significant effect on customer satisfaction in hotels.
H2: Reliability has significant effect on customer satisfaction in hotels.
H3: Responsiveness has significant effect on customer satisfaction in hotels.
H4: Empathy has significant effect on customer satisfaction in hotels.
H5: Assurance has significant effect on customer satisfaction in hotels.
H6: Corporate image has significant effect on customer satisfaction in hotels.
H7: Core hotel benefits have significant effect on customer satisfaction in hotels.
Study area
This study was carried out in Debre Markos town which is located in the North western part of Ethiopia. The town is found in Eastern Gojjam, Amhara regional state and it is 300 km far away from the capital city of Addis Ababa. Since previous researches regarding the effect of service quality on customer satisfaction have done only in star hotels in the capital city of Addis Ababa, the researcher is motivated to determine the effect of service quality on customer satisfaction in medium level hotels of Debre Markos town because the researcher believes that the service quality and customers’ satisfaction is different on these two places.
Research design
The research design that was used in this study was both descriptive and explanatory study design. Descriptive research design will help in describing the service quality dimensions, existing situation and the frequency with which an event occurs and explanatory study design is used in determining the relationships between service quality dimensions and customer satisfaction. The research approach of the study is quantitative. A quantitative technique is used to analyze means, percentages, standard deviations and the correlation between independent and dependent variables.
The research has been carried out through the use of cross-sectional survey design. Cross-sectional design also known as one- shot and it is best suited to studies aimed at finding out the prevalence of a phenomenon, situation, problem, attitude or issue by taking a cross-section of the population. It is useful in obtaining an overall picture as it stands at the time of the study and is designed to study some phenomenon by taking a cross-section of it at one time [12].
Sample size and sampling technique
Sampling techniques provide a range of methods that enable one to reduce the amount of data needed for a study by considering only data from a sub-group rather than possible element. According to East Gojjam office of culture and Tourism (2015) report, the total population of hotels in Debre Markos Town is 52. Since most of the hotels are below the criteria that was adopted internationally, the office of culture and tourism simply classify hotels on the prevailing conditions of the surrounding areas into two categories namely medium and lower level with their number of bedrooms, size of bed rooms, parks and the like they have and other services. Out of the total hotels, 15 hotels are classified under the category of medium level and the remaining 37 hotels are classified in the category of lower level.
As a result, due to time and financial constraints, the researcher is forced to examine only medium level hotels to know the service quality of these hotels in the town. To take the representative samples from the total target population of 15 medium level hotels, the researcher selected 5 hotels using simple random sampling techniques of lottery method on account of the hotels’ homogenous characteristics. After the selection of sample hotels, the respondents were determined. Since it was difficult to get information about the number of customers in hotels, the researcher took week total population information of 15,442 from hotels’ managers and used the average per day per hotel and the sum total of 2206 was the total number of population. For populations that are large and infinite, the sample size was determined by the formula which was developed by Cochran (1963) as cited (Israel, 1992). It can be calculated as follows.
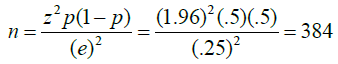
Where,
n - The sample size
Z - Level of confidence.
e - The acceptable sampling error (0.05)
p - The estimated proportion of an attribute that is present in the population
Hence, the total sample size is 384. Since the number of customers in each hotel is not the same, the number of samples for each hotel was proportionately distributed as illustrated in Table 1.
| Name of hotels | Customer population/day | Number of sampled customers |
|---|---|---|
| Sewnet Degu | 325 | 57 |
| FM | 565 | 98 |
| National hotel | 502 | 87 |
| Nubia | 313 | 55 |
| Tilik | 501 | 87 |
| Total | 2206 | 384 |
Data source and collection method
For the proper achievement of the objectives of the study, the researcher used primary source of data. In order to dispatch the questionnaires to the respondents, the researcher asked and gained permission from 5 hotels and the Amharic version of the questionnaire was distributed for four weekend days to customers by the researcher and one enumerator using convenience sampling techniques because there is no point in time during which all customers are available and it is difficult to contact everyone who may be sampled. As a result, the researcher simply contacted with the customers/respondents/ and gather data using close ended self-administered questionnaires.
Standardized questionnaires were adopted from different sources namely: Corporate image which has 6 items of questionnaires from [13]. Core hotel benefits which has 5 items of questionnaires from Veasna, 2013 and also the rest service quality dimensions’( tangibility, reliability, responsiveness, empathy and assurance) 22 items of questionnaires and 6 item questionnaires for customer satisfaction were adopted from [14]. Tangibility has 4 items, reliability 5 items, responsiveness has 4 items, assurance with 5 items and empathy has 4 items of questionnaires and the total numbers of questionnaires are 33 for independent variables/service quality dimensions and 6 items for dependent variables/customer satisfaction. The five point likert scale which includes strongly disagree (1), disagree (2), neutral (3), agree (4) and strongly agree (5) was used to enhance their cooperation and ultimately to ensure maximum response rate.
The SERVPERF model is found to be superior to the SERVQUAL model because it reduces the number of items to be measured by 50℅ from 44 items to 22 items. In this study, the themes and contents of the questionnaires have been prepared and organized in light of the SERVPERF model based on five likert scales and is used to measure service quality in hotels. On the other hand, secondary information was also used to support the idea of service quality dimensions and customer satisfaction with related literatures such as articles, journals, books, and annual reports.
Reliability and validity test
Cronbach’s alpha has been employed to evaluate the reliability scale of the dimension of each construct and the results are indicated in Table 2.
| Dimensions of service quality | Cronbach’s alpha | |
|---|---|---|
| Tangibility | 0.72 | 0.79 |
| Reliability | 0.97 | |
| Responsiveness | 0.75 | |
| Empathy | 0.92 | |
| Assurance | 0.71 | |
| Corporate image | 0.73 | |
| Core hotel benefits | 0.78 | |
| Customer satisfaction | 0.75 | |
Pilot test was used to pre-test or try out a research instrument. The sample size of 10℅-20℅ is a reasonable number of participants to carry out for pilot test. Therefore, the researcher held with Pilot test by distributing 10℅ (38) of the total sample size and was dispatched to the respondents of the selected samples of hotels proportionately. The Cronbach alpha greater than 0.7, has high reliability and if it is smaller than 0.3, then it implies that there is low reliability. Hence, the reliability test result was 0.68 for the overall service quality dimensions and 0.65 for customer satisfaction which is below 0.7 and was unacceptable. On account of this, the researcher made little modification for two questions from corporate image and one question from core hotel benefits and one question from customer satisfaction which were vague for the respondents and make them consistence so that the reliability test of the main survey for the overall service quality dimensions and customer satisfaction was 0.79 and 0.75 respectively as shown in the Table 2.
Since validity is the degree to which any measurement approach or instrument succeeds in describing or quantifying what it is designed, questionnaires’ face and content validity were checked by the researcher’s advisors and other professionals who have been working in Debre Markos University.
Methods of data processing and analysis
The data that was obtained from questionnaires was processed (i.e., edited, coded, tabulated) and then analyzed according to the objective of the study. Further transformation of the processed data to look for relationship between variables was made by using descriptive and correlation statistical analysis. To analyze the data, both descriptive and inferential statistics are used. Specifically, descriptive statistics (Tables, frequency distribution, and percentage) and Pearson correlation and multiple linear regressions were applied in the study. Descriptive analysis was used to describe data obtained from questionnaire to reduce the data into a summary format.
In addition, person’s correlation coefficient was used to determine the relationship between service quality dimensions (tangibility, reliability, responsiveness, empathy, assurance, core hotel benefits and corporate image) and customer satisfaction. Moreover, multiple regression analysis was used to examine the effect of service quality dimensions (tangibility, reliability, responsiveness, empathy, assurance, core hotel benefits and corporate image) on customer satisfaction. It is used because the study has multiple predictors and a single outcome. This model was used to examine how multiple independent variables are related to a dependent variable as well as the actual predictive ability of the model for future cases. If there is more than one independent variable, there may be more accurate prediction on the dependent variable.
The equation of multiple regressions on this study was generally built around two sets of variables, namely dependent variable (customer satisfaction) and independent variables (tangibility, reliability, responsiveness, empathy, assurance, core hotel benefits and corporate image). The basic objective of using regression equation on this study was to make the researcher more effective at describing, understanding, predicting and controlling the stated variables.
Regress customer satisfaction on the service quality dimensions

Where,
Y- is the dependent variable—customer satisfaction
X1, X2, X3, X4, X5, X6, and X7 are explanatory variables or the regresses.
βo- is the intercept term- it gives the mean or average effect on Y of all the variables excluded from the equation, although its mechanical interpretation is the average value of Y when the stated independent variables are set equal to zero.
Β1, β2, β3, β4, β5, β6, β7 refers to the coefficient measures the change in the mean value of Y, per unit change in their respective independent variables.
Ɛ - Refers to error term
Response rate
The total of 384 questionnaires were distributed to the respondents/ customers and 322 (84℅) was collected and the remaining 62 (16℅) were not returned. Among the collected questionnaire i.e., 322 (84℅), 17 questionnaires were not filled properly and then rejected. As a result, the analysis was made based on 305 questionnaires and the response rate was 80℅. The response rate which accounts for 70℅ and above of the sample size is sufficient for the analysis of a given research. That the researcher took 80℅ response rate for analysis.
Back ground of the respondents
This research was enclosed the main back ground information such as sex, age groups, educational levels, marital status, and occupation. Sex was considered to find out whether male or female customers have been highly involved on the rendered service in hotels and age group was also considered to identify which age groups were dominantly got service from hotels. Moreover, educational level, marital status and occupation of respondents were included to know whether most of the customers of the hotels are educated, married, and employed or not and the findings were indicated in Table 3.
| Variables | Category | Frequency | Percent |
|---|---|---|---|
| Sex | Male | 206 | 67.5 |
| Female | 99 | 32.5 | |
| Age group | 18-25 | 81 | 26.6 |
| 26-35 | 121 | 39.7 | |
| 36-45 | 75 | 24.6 | |
| 46-55 | 21 | 6.9 | |
| >55 | 7 | 2.3 | |
| Educational level | Illiterate | 0 | 0 |
| Below certificate | 8 | 2.6 | |
| Certificate | 22 | 7.2 | |
| Diploma | 120 | 39.3 | |
| Degree | 151 | 49.5 | |
| MA and above | 4 | 1.3 | |
| Marital status | Married | 159 | 52.1 |
| Single | 92 | 30.2 | |
| Divorced | 47 | 15.4 | |
| Widowed | 7 | 2.3 | |
| Occupation | Student | 6 | 2.0 |
| Retire | 5 | 1.6 | |
| Self- employed | 62 | 20.3 | |
| Government employed | 186 | 61.0 | |
| Private sector employed | 34 | 11.1 | |
| Jobless | 12 | 3.9 |
Regarding to the sex distribution of the respondents in Table 3, showed that 206 (67.5℅) of the respondents were males and the remaining 32.5℅ (99) of the respondents were females. This implies that males were more users of hotels’ services in DMT. Moreover, the age category of the respondents implied that the majority 202 (66.3℅) of the respondents were under and equal age group of 35 years old and 103 (33.8℅) of the respondents were above age group of 35 years old so that majority of the customers who visit the hotels were youngsters.
Concerning the educational level of the respondents in Table 3, portrayed that the majority 151 (49.5℅) of the respondents were BA/BSC holders, 120 (39.3℅) were diploma holders and the remaining 7.2℅, 2.6℅ and 1.3℅ of the respondents were certificate, below certificate and MA and above respectively. Hence, most of the respondents/customers who got service in the hotels were educated. In addition, the marital status indicated that 52.1℅ of the respondents were married; 30.2℅ of the respondents were single and the remaining 15.4℅ and 2.3℅ were divorced and widowed respectively. From this, the researcher concluded that even though most of the respondents were married, they were users of the products and services of hotels. On the other hand, the occupation of the customers implied that government employees were represented 61℅ of the respondents, 20.3℅ of the respondents were engaged in self-employed whereas 11.1℅ of them were private sector and 3.9℅ were jobless. The rest 2 ℅ and 1.6 ℅ of respondents were students and retire respectively. This shows that the government employees were the main customers of hotels.
Analysis of service quality dimensions
Analysis of customers’ perception about tangibility: Tangibility includes physical facilities, equipment’s, and personal neatness of the organization. Customers of the hotels were asked about the attractiveness of various equipments and neatness of employees in the hotels and the findings is shown in Table 4.
| S.no | questions | SD | disagree | neutral | agree | SA | mean | STD | N |
|---|---|---|---|---|---|---|---|---|---|
| 1 | The hotel has modern-looking equipment. | 8 (2.6℅) |
4 (1.3℅) |
230 (75.4℅) |
59 (19.3℅) |
4 (1.3℅) |
3.15 | 0.58 | 305 |
| 2 | The hotel has neat and disciplined employees. | 4 (1.3℅) |
49 (16.1℅) |
237 (77.7℅) |
12 (3.9.℅) |
3(1℅) | 2.87 | 0.53 | 305 |
| 3 | Room is clean and provides adequate of space. | 5 (1.6℅) |
87 (28.5℅) |
196 (64.3℅) |
15 (4.9℅) |
2 (0.7℅) |
2.74 | 0.60 | 305 |
| 4 | Employees’ uniforms are attractive. | 14 (4.6℅) |
148 (48.5℅) |
116 (38℅) |
14 (4.6℅) |
13 (4.3℅) | 2.55 | 0.83 | 305 |
| Average response | 31 (2.53℅) |
288 (23.60℅) |
779 (63.85℅) |
100 (8.20℅) |
22 (1.80℅) |
2.83 | 0.48 | 1220 (100℅) |
|
| 26.13℅ | 63.85℅ | 10℅ | |||||||
As illustrated in the Table 4, respondents replied that they were satisfied or agreed on the existence of modern-looking equipment with a mean score of 3.15 and they were dis satisfied/disagree/ with the neatness and disciplined of employees of the hotel with a mean score of 2.87. Besides, regarding to the cleanliness of the hotels’ rooms, respondents were also dissatisfied/disagree/ with a mean score of 2.74. On the contrary, respondents were not satisfied with the employees’ uniforms attractiveness. As a result, since the average mean score of tangibility was 2.83, it showed that the majority of customers/ respondents were disagree or dissatisfied on the existence of attractive physical facilities in the hotels.
Analysis of customers’ perception about reliability: Reliability is connected to the consistency of performance and dependability. This dimension includes employees’ consistency of courteous, fast service, effective handling of complaints, provision of appropriate information and dependability in handling of service problems (Table 5).
| S.no | questions | SD | Disagree | neutral | agree | SA | mean | STD | N |
|---|---|---|---|---|---|---|---|---|---|
| 1 | The hotel provides fast services. | 150 (49.2℅) |
9 (3℅) |
93 (30.5℅) |
38 (12.5℅) |
15 (4.9℅) |
2.21 | 0.85 | 305 |
| 2 | Employees are consistently courteous. | 9 (3℅) |
25 (8.2℅) |
104 (34.1℅) |
28 (9.2℅) |
139 (45.6℅) | 3.20 | 1.17 | 305 |
| 3 | The employees handled customer’s complaints effectively. | 11 (3.6℅) |
61 (20℅) |
69 (22.6℅) |
61 (20.2℅) |
103 (33.5℅) |
3.21 | 1.24 | 305 |
| 4 | Employees provide accurate information to customers. | 23 (7.5℅) |
18 (5.9℅) |
106 (34.8℅) |
94 (30.8℅) |
64 (21℅) |
3.52 | 1.12 | 305 |
| 5 | Employees show dependability in handling service problem. | 29 (9.5℅) |
61 (20℅) |
47 (15.4℅) |
160 (52.5℅) |
8 (2.6℅) |
3.19 | 1.07 | 305 |
| Average response | 222 (14.56℅) |
174 (11.41℅) |
419 (27.48℅) |
381 (24.98℅) |
329 (21.57℅) |
3.06 | 1.09 | 1525 (100℅) |
|
| 25.97℅ | 27.48℅ | 46.55℅ | |||||||
As Table 5, showed, the majority 150 (49.2℅) of respondents revealed that they were dissatisfied/ strongly disagree regarding the fast service of hotels and they were dissatisfied with the mean score of 2.21. This shows that hotels did not give the required service in a fast manner and on time for the customers. On contrary, respondents were satisfied with the employees’ courteous with a mean score of 3.20 that was shown during service delivery in the hotel. This indicates that employees’ behavior is suitable for the customers even if they do not render the required service on time.
Similarly, respondents were also satisfied with the items of effective handling of complaints, provision of accurate information and dependable handling of service problems with the mean score of 3.21, 3.52 and 3.19 respectively. These results also indicated that since employees were courteous in their behavior, the occurrence of complaints was rare and if it occurred, they could simply solve the problem on themselves. Employees had also the willingness to give the accurate information to customers while staying in the hotels. Moreover, the average response rate implied that respondents were satisfied with the provided service in the hotel with the average response rate of 3.06. From this, the researcher concluded that the service quality dimension related to reliability was satisfactory for the customers of hotels in the town.
Analysis of customers’ perception about responsiveness: According to Gronroos 1983 responsiveness concerns to what extent the employees are prepared to provide service. As his findings, the dimension involves factors such as willingness of employees to serve customers, provision of diversified service, delivery of prompt service and rendering quick response to customer requests (Table 6).
<| S.no | questions | SD | disagree | neutral | agree | SA | mean | STD | N |
|---|---|---|---|---|---|---|---|---|---|
| 1 | Employees are willing to serve the customer. | 32 (10.49℅) |
95 (31.15℅) |
130 (42.62℅) |
33 (10.82℅) |
15 (4.92℅) |
3.30 | 0.68 | 305 |
| 2 | The hotel provides diversified service to the customers. | 55 (18.03℅) |
131 (42.95℅) |
104 (34.10℅) |
7 (2.3℅) |
8 (2.62℅) |
2.85 | 0.58 | 305 |
| 3 | The hotel gives prompt service. | 67 (21.97℅) |
132 (43.28℅) |
81 (26.56℅) |
16 (5.25℅) |
9 (2.95) |
2.78 | 0.56 | 305 |
| 4 | The hotel gives quick response to customer requests. | 72 (23.6℅) |
112 (36.72℅) |
87 (28.5℅) |
13 (4.26℅) |
21 (6.89℅) |
2.90 | 0.59 | 305 |
| Average response | 226 (18.52℅) |
470 (38.52℅) |
402 (32.95℅) |
69 (5.65℅) |
53 (4.34℅) |
2.94 | 0.63 | 1220 (100℅) |
|
| 57.04℅ | 32.95℅ | 9.99℅ | |||||||
As shown in the Table 6, 130 (42.62℅) of respondents revealed that they were neither satisfied nor dissatisfied (neutral) on the item of employees’ happiness and willingness during delivery of service in the hotels. As it is understood from Table 6, even if the majority of the respondents replied the unhappiness and unwillingness of employees to deliver service, the total respondents’ mean score 3.30 indicated that they were satisfied with the behavior of service providers in the hotel.
On the other hand, the respondents’ level of satisfaction was low or they were dissatisfied/dis agree/ with mean score of 2.85 in hotel’s diversified provision of services. This implied that medium level hotels of Debre Markos town were rendering many services to the customers. Similarly, respondents were dissatisfied with the prompt service and quick response with the mean score of 2.78 and 2.90 respectively. As it is understood from these mean scores, customers were not given quick and prompt service at the time of order so that they were forced to waste much time in the hotels. Similarly, since the average response rate of respondents was 2.94, the researcher concluded that respondents /customers were moderately satisfied with the dimension of responsiveness.
Analysis of customers’ perception about empathy: According to Zeithaml VA, et al., 1990 empathy is about easy access, good communication and understanding the customer. As it is defined by the researchers, good communication is about keeping the customer informed in a language they can understand and also listen to the customer. Gronroos, found that understanding the customer is about making an effort to understand the customer which involves learning about specific requirements, providing individualized attention and recognizing the regular customers. This dimension includes factors like friendly treatment of customers, understanding of customers’ specific needs, respecting of customers and individual attention to customers (Table 7).
| S.no | questions | SD | disagree | neutral | agree | SA | mean | STD | N |
|---|---|---|---|---|---|---|---|---|---|
| 1 | Employees always treat customers in a friendly manner. | 27 (8.9℅) |
33 (10.8℅) |
146 (47.9℅) |
38 (12.5℅) |
61 (20℅) |
3.25 | 1.16 | 305 |
| 2 | Employees understand customers' specific needs. | 19 (6.2℅) |
45 (14.8℅) |
167 (54.8℅) |
30 (9.8℅) |
44 (14.4℅) |
3.13 | 1.03 | 305 |
| 3 | Employees treat customers with great respect. | 9 (3℅) |
95 (31℅) |
131 (43℅) |
64 (21℅) |
6 (2℅) |
2.90 | 0.84 | 305 |
| 4 | Employees give individual attention to customers. | 56 (18.4℅) |
128 (42℅) |
49 (16.1℅) |
56 (18.4℅) |
16 (5.2℅) |
2.6 | 1.14 | 305 |
| Average response | 111 (9.1℅) |
301 (24.67℅) |
493 (40.41℅) |
188 (15.41℅) |
127 (10.41℅) |
3.01 | 0.35 | 1220 (100℅) |
|
| 33.77℅ | 40.41 | 25.82℅ | |||||||
As it is illustrated in Table 7, respondents were asked about the friendly treatment, understanding of specific needs, great respect and individual attention of employees for customers. Regarding to the item of friendly treatment of employees with customers, the majority 146 (47.9℅) of the respondents explained that they were neutral (neither satisfied nor dissatisfied) but the mean score value (3.25) showed that respondents were satisfied with the friendly treatment of employees. This revealed that employees had good relations with the customers and could treat them friendly when they faced any problem related with service in the hotels.
In line with the item of friendly treatment manner of employees with customers, respondents also depicted that employees could understand their needs while they were providing service in the hotel and the mean score (3.13) of the item implied that respondents’ level of satisfaction was high. On contrast to this, the remaining factors namely great respecting and individual attention given to customers were not satisfactory with the mean scores of 2.9 and 2.6 respectively. Hence, customers were less satisfied with the respect of employees given to them as well as with the given attention. However, since the total average response rate was 3.01, the researcher concluded that respondents were satisfied with the dimension of empathy.
Analysis of customers’ perception about assurance: Assurance is about competence, credibility and security also defined competence that it is connected to knowledge and skills of contact personnel, operational support of personnel that are needed for delivering the service. He identified the factors of credibility such as trustworthiness, believability and honesty. Assurance is about the employees’ required skills in providing service, trustworthy, sufficient knowledge and confidentiality on their service in the hotel (Table 8).
| S.no | questions | SD | disagree | neutral | agree | SA | mean | STD | N |
|---|---|---|---|---|---|---|---|---|---|
| 1 | The employee has the required skill in providing services. | 58 (19.02℅) |
67 (21.97℅) |
104 (34.09℅) |
49 (16.07℅) |
27 (8.85℅) |
2.73 | 0.64 | 305 |
| 2 | Hotel employees are trustworthy. | 43 (14.09℅) |
91 (29.83℅) | 82 (26.88℅) |
36 (11.80℅) |
53 (17.37℅) |
2.88 | 0.78 | 305 |
| 3 | The employees have sufficient knowledge of service. | 69 (22.62℅) |
53 (17.37℅) |
115 (37.7℅) |
45 (14.75℅) |
23 (7.54℅) |
2.67 | 0.49 | 305 |
| 4 | The employees make customers feel safe in their service. | 62 (20.33℅) |
93 (30.49℅) |
75 (24.59℅) |
50 (16.39℅) |
25 (8.19℅) |
2.61 | 0.48 | 305 |
| 5 | Employee makes customers feel confident on their service. | 47 (15.41℅) |
79 (25.9℅) |
92 (30.16℅) |
46 (15.08℅) |
41 (13.44℅) |
2.85 | 0.86 | 305 |
| Average response | 279 (18.29℅) |
383 (25.11℅) |
468 (30.68℅) |
226 (14.82℅) |
169 (11.08℅) |
2.74 | 1525 (100℅) |
||
| 43.4℅ | 30.68℅ | 25.9℅ | |||||||
Respondents were also asked about the employees’ skills, trustworthiness, sufficient knowledge, safe service delivery and confidentiality during service delivery in hotels. As it can be understood from Table 4, the majority (41℅) of respondents replied that they were disagree or dissatisfied with the item of employees’ skills but the mean score of 2.73 showed that customers were less satisfied with that item. This implied that the employees were not being trained and lacked the necessary skills of how to deliver service in the hotels. Similarly, the majority (43℅) of respondents depicted that they were disagree or dissatisfied with the item of employees’ trustworthiness so that customers had no believes on service providers though the mean score of (2.88) the item depicted their less level of satisfaction in the hotels.
In addition to this, the respondents were also dissatisfied with the items of sufficient knowledge, safe in their service and confidential service with the mean scores of 2.67, 2.61 and 2.85 respectively. As it can be understood from these three items, employees did not have the required knowledge to render service and customers were not free and confidential with the service providers of hotels. From this, the researcher concluded that customers were dis satisfied/disagree/ with the dimension of assurance with the mean score of 2.74.
Analysis of customers’ perception about corporate image: Corporate image is the overall impression left in the customers’ mind as a result of accumulative feelings, ideas, attitudes and experiences with the organization, stored in memory transformed in to a positive/negative meaning retrieved to reconstruct image and recalled when the name of the organization is heard or brought to one’s mind. Corporate image is as an attitude of customers towards a firm that results from the accumulation of all received information about the firm. In this study, the researcher asked the respondents’ perception about the hotels’ reputation, promotion they notify themselves, designed menu, high visibility, public and environmental protection activities, and favor and patronage of celebrities and the result is illustrated as follows in Table 9.
| S.no | questions | SD | disagree | neutral | agree | SA | mean | SD | N |
|---|---|---|---|---|---|---|---|---|---|
| 1 | There is beautifully designed menu. | 9 (3℅) |
47 (15.4℅) |
179 (58.7℅) |
63 (20.7℅) |
7 (2.3℅) |
3.04 | 0.75 | 305 |
| 2 | The hotel has multiple promotions. | 9 (3℅) |
86 (28.2℅) |
195 (63.9℅) |
8 (2.6℅) |
7 (2.3℅) |
2.73 | 0.67 | 305 |
| 3 | It has a good reputation. | 2 (0.7℅) |
81 (26.6℅) |
179 (58.7℅) |
40 (13.1℅) |
3 (1℅) |
2.87 | 0.67 | 305 |
| 4 | Hotel has very high visibility. | 2 (.7℅) |
110 (36℅) |
167 (54.8℅) |
24 (7.9℅) |
2 (.7℅) |
2.72 | 0.64 | 305 |
| 5 | Hotel often puts public and environmental protection activities. | 2 (0.7℅) |
90 (29.5℅) |
198 (64.9℅) |
11 (3.6℅) |
4 (1.3℅) |
2.75 | 0.59 | 305 |
| 6 | Hotel often wins the favor and patronage of celebrities. | 9 (3℅) |
118 (38.7℅) |
134 (43.9℅) |
41 (13.4℅) |
3 (1℅) |
2.71 | 0.77 | 305 |
| Average response | 33 (1.80℅) |
532 (29.1℅) |
1052 (57.49℅) |
187 (10.23℅) |
26 (1.42℅) |
2.80 | 0.44 | 1830 (100℅) |
|
| 30.9℅ | 57.49℅ | 11.65℅) | |||||||
Concerning the hotels’ beautiful designed menu, Table 9, indicated that the majority 179 (58.7℅) of the respondents were neither satisfied nor dissatisfied, but the item’s mean score (3.04) implied that they were satisfied with the menu designs which were available in the hotels. On the other hand, respondents were less satisfied with the hotels’ promotions with the mean score of 2.73.
This indicated that hotels of DMT did not advertise their products and services to the customers/ population. Similarly, respondents were asked about their level of satisfaction on the hotels’ good reputation and replied that they were dissatisfied/disagree/ with its mean score of 2.87. Consequently, hotels did not have good reputation on their activities on the minds of the customers. In addition, regarding to public and environmental protection activities and the favor and patronage of celebrities of hotels in the town, respondents were also dissatisfied with the mean scores of (2.75) and (2.71) respectively. Hence, the mean score (2.80) of the six items of the dimension of corporate image implied that the respondents’ level of satisfaction was low.
Analysis of customers’ perception about core hotel benefits: Core hotel benefit is one of the dimensions of service quality which can affect customer satisfaction in hotels. as cited suggested that giving comfortable, relaxed and welcome feeling, quietness of rooms, security of room, comfortable and clean mattress, pillows, beds, sheets and covers, reasonable room rates and variety of basic products and services offered (including tooth paste, soaps shampoo, towels, toilet papers etc.) are the most dimensions of service quality (Table 10).
| S.no | questions | S D | disagree | neutral | agree | SA | mean | STD | N |
|---|---|---|---|---|---|---|---|---|---|
| 1 | The hotel has comfortable, relaxed and welcome feelings. | 16 (5.2℅) |
65 (21.3℅) |
199 (65.2℅) |
14 (4.6℅) |
11 (3.6℅) |
2.80 | 0.75 | 305 |
| 2 | Rooms are quiet enough. | 7 (2.3℅) |
81 (26.6℅) |
87 (28.52℅) |
104 (34.01℅) |
26 (8.5℅) |
3.20 | 0.71 | 305 |
| 3 | The hotel has comfortable and clean mattresses, pillows, beds, sheets and covers. | 7 (2.3℅) |
68 (22.3℅) |
144 (47.2℅) |
76 (24.9℅) |
10 (3.3℅) |
3.05 | 0.83 | 305 |
| 4 | There is reasonable room rate in the hotel. | 4 (1.3℅) |
95 (31.1℅) |
115 (37.7℅) |
70 (23℅) |
21 (6.9℅) |
3.02 | 0.76 | 305 |
| 5 | Variety of basic products and services (toothpaste, soap, shampoo, towel, toilet paper, drinking water) are offered for customers in the hotel. | 8 (2.6℅) |
87 (28.5℅) |
190 (62.29℅) |
5 (1.6℅) |
15 (4.92℅) |
2.69 | 0.57 | 305 |
| Average response | 42 (2.75℅) |
396 (25.96℅) |
735 (48.19℅) |
269 (17.64) |
83 (5.44℅) |
2.95 | 1525 (100℅) |
||
| 28.71℅ | 48.71℅ | 23.08℅ | |||||||
Regarding to the comfortable, relaxed and welcome feelings of hotels, Table 10, respondents were asked and replied that they dissatisfied/disagree/ with the mean score of (2.8) this indicated that employees did not show comfortable, relaxed and welcome feelings while guests are coming to the hotels. On the other hand, respondents revealed that they were satisfied on the quietness of rooms with its mean scores of (3.2). This implies that hotels had good environment or they had no disturbance around bed rooms so that guests could feel safe while they were sleeping.
Customers of hotels were also asked about the hotels’ comfortable and neatness of mattress, pillows, beds, sheets and covers and depicted that they were satisfied with these items. Since the mean score of (3.05) the item is greater than the mean value, respondents were satisfied with the neatness and comfortable of bed rooms in the hotels. This showed that medium level hotels were keeping the safety of guests who were staying in their bed rooms.
The other item that respondents were satisfied was that hotels had reasonable room rate with its mean score of 3.02. As it is indicated from the response of respondents, hotels have designed their fair bed price in accordance with the purchasing power of customers. On the other hand, respondents were dissatisfied with the provision of variety of basic products and services (tooth paste, soap, shampoo towel, toilet paper, and drinking water) with mean score of (2.69). The mean score of (2.69) revealed that hotels were providing some of the products and services but did not deliver all the required benefits for the guests. As a result, since the mean score value of the dimension of core hotel benefit is (2.9), the researcher concluded that the respondents were less satisfied with the provision of some products and services by hotels even if they did not deliver all the necessary core hotel benefits for customers.
Analysis of customer satisfaction
Analysis of customers’ perception about customer satisfaction: Customer satisfaction has emerged as one of powerful tools for sustaining a competitive advantage for business success and survival now a day, through excellence service quality. He explained that excellent service is a profit strategy because it results in more new customers, more business with existing customers, few lost customers, more insulations from price competition and fewer mistakes requiring the re-performance of service.
Maximizing customer satisfaction will maximize profitability and market share. According to Cengiz, market-oriented industries and organizations live and die with the satisfaction of their customers and thus view customer satisfaction as their life line. He also found that in those industries, extensive efforts are made to gauge customer reactions to services in a continuous effort to improve, build and expand market share (Table 11).
| R.no | questions | S D | disagree | neutral | agree | SA | mean | STD | N |
|---|---|---|---|---|---|---|---|---|---|
| 1 | The hotel has comfortable, relaxed and welcome feelings. | 16 (5.2%) |
65 (21.3%) |
199 (65.2%) |
14 (4.6%) |
11 (3.6%) |
2.80 | 0.75 | 305 |
| 2 | Rooms are quiet enough. | 7 (2.3%) |
81 (26.6%) |
87 (28.52%) |
104 (34.01%) |
26 (8.5%) |
3.20 | 0.71 | 305 |
| 3 | The hotel has comfortable and clean mattresses, pillows, beds, sheets and covers. | 7 (2.3%) |
68 (22.3%) |
144 (47.2%) |
76 (24.9%) |
10 (3.3%) |
3.05 | 0.83 | 305 |
| 4 | There is reasonable room rate in the hotel. | 4 (1.3%) |
95 (31.1%) |
115 (37.7%) |
70 (23%) |
21 (6.9%) |
3.02 | 0.76 | 305 |
| 5 | Variety of basic products and services (toothpaste, soap, shampoo, towel, toilet paper, drinking water) are offered for customers in the hotel. | 8 (2.6%) |
87 (28.5%) |
190 (62.29%) |
5 (1.6%) |
15 (4.92%) |
2.69 | 0.57 | 305 |
| Average response | 42 (2.75%) |
396 (25.96%) |
735 (48.19%) |
269 (17.64) |
83 (5.44%) |
2.95 | 1525 (100%) |
||
| 28.71% | 48.71% | 23.08% | |||||||
As it is depicted in Table 11, respondents were requested whether they were satisfied with the service which were rendered in the hotels or not and the majority 177(58.03℅) of the with respondents replied that they were neither satisfied nor dissatisfied with the hotels’ complete range of services. This implied that customers were less satisfied the provided services in the hotels and the mean score of (2.90) depicted that they were disagree/dissatisfied/ on the given item.
With related to the performance of hotels’ employees, the majority 222 (72.8℅) of the respondents were explained that they were neither satisfied nor dissatisfied and the item’s mean score value (2.52) indicated that respondents were less satisfied on the employees’ performance in hotels. Hence, it can be identified that the service providers of hotels could not give fast and active service to the guests in medium level hotels. Similarly, the respondents were also requested to give their response about the employees’ competency in the hotel and revealed that they were dissatisfied with the mean score of (2.56). The mean score (2.56) shows that employees were not well equipped for the provision of services in the hotels.
Moreover, the respondents were also asked about the quick service delivery of hotels and they replied that their level of satisfaction is near to average (2.53) or they were less satisfied with the item of being a client of hotels. Like the other items which were mentioned in the dimensions of customer satisfaction, respondents were disagreed with the item of the respectful behavior of employees with customers with the mean scores of (2.63). On the contrary, the respondents were dissatisfied with the mean score of (2.40) on the item of being clients of hotels. This showed that customers were not satisfied with the overall activities of hotels. From this, the researcher concluded that customers were dissatisfied with the dimension of the dependent variable /customer satisfaction/ in the medium level of hotels in DMT.
Pearson correlation analysis
To determine the relationship between service quality dimensions/ tangibility, reliability, responsiveness, empathy, assurance, core hotel benefits and corporate image/and customer satisfaction, correlation was computed. The results of Pearson correlation on the relationship between service quality dimensions and customer satisfaction is discussed in the following Table 12.
**Correlation is significant at the 0.01 level (2-tailed).
** Correlation is significant at the 0.05 level (2-tailed).
| Customer Satisfaction | ||
|---|---|---|
| Tangibility | Pearson Correlation | .630** |
| Sig. (2-tailed) | .000 | |
| N | 305 | |
| Reliability | Pearson Correlation | .097 |
| Sig. (2-tailed) | .089 | |
| N | 305 | |
| Empathy | Pearson Correlation | .103 |
| Sig. (2-tailed) | .074 | |
| N | 305 | |
| Assurance | Pearson Correlation | .662** |
| Sig. (2-tailed) | .000 | |
| N | 305 | |
| Responsiveness | Pearson Correlation | .594** |
| Sig. (2-tailed) | .000 | |
| N | 305 | |
| Corporate image | Pearson Correlation | .699** |
| Sig. (2-tailed) | .000 | |
| N | 305 | |
| Core hotel benefits | Pearson Correlation | .560** |
| Sig. (2-tailed) | .000 | |
| N | 305 | |
The results in the Table 4, implied that there is positive and significant relationship between tangibility and customer satisfaction (r=0.630, P < 0.01), assurance and customer satisfaction (r=0.662, P < 0.01), responsiveness and customer satisfaction (r=0.594, P < 0.01), corporate image and customer satisfaction (r=0.699, P < 0.01), core hotel benefits and customer satisfaction (r=0.560, P < 0.01). However, there is positive and insignificant relationship between reliability and customer satisfaction (r=0.097, P> 0.05) and empathy and customer satisfaction (r=0.103, P > 0.05).
If the correlation between two variables is from 0 to 0.19, very weak, from 0.20 to 0.39, weak, from 0.40 to 0.59, moderate, from 0.60 to 0.79, strong and from 0.80 to 1 very strong. Hence, the correlation between tangibility and customer satisfaction (r=0.630, P < 0.01), assurance and customer satisfaction(r=0.662, P < 0.01) and corporate image and customer satisfaction(r=0.699, P < 0.01) is strong. Moreover, the correlation result between reliability and customer satisfaction(r=0.594, P < 0.01), core hotel benefits and customer satisfaction(r=0.560, P < 0.01) is moderate. On the other hand, the correlation between reliability and customer satisfaction (r=0. 097, P > 0.05), empathy and customer satisfaction (r=0.103, P > 0.05) is moderate and insignificant. Regarding multi-co linearity test: - in multiple regression analysis, multi-co linearity test refers to the correlation among the independent variables. It is not a threat if a correlation value is less than 80℅. Hence, the researcher checked the absence of multi-co linearity before doing the multiple regression analysis and attached at appendices.
Multiple regression analysis
Multiple regression analysis was employed to determine the effect of service quality dimensions on customer satisfaction. The following Table presents the results of multiple regression analysis (Table 13). From the Table 13, it has been observed that R value is 0.850. Therefore, R value (0.850) for the overall service quality dimensions namely tangibility, reliability, responsiveness, empathy, assurance, corporate image and core hotel benefits suggested that there is a strong effect of these seven independent variables on customer satisfaction. The R Squared supposes that every independent variable in the model explains the variations in the dependent variables and also gives the percentage of explained variation as if all independent variables in the model affect the dependent variables. As a result, the researcher used adjusted R Square which is used to give the percentage of variation explained by only those independent variables that in reality affect the dependent variables.
| Model | R | R Square | Adjusted R Square | Std. Error of the Estimate |
|---|---|---|---|---|
| 1 | .850a | .723 | .716 | .22082 |
Hence, Table 14 shows that the adjusted R Square value is 0.716. This result indicates that the independent variable (service quality dimensions) accounted for is 71.6℅ of the variance in customer satisfaction. Thus, 71.6℅ of the variation in customer satisfaction can be explained by these service quality dimensions and the other unexplored variables may explain the variation in customer satisfaction which accounts for 28.4℅ (Table 14).
| ANOVAa | ||||||
|---|---|---|---|---|---|---|
| Model | Sum of Squares | df | Mean Square | F | Sig. | |
| 1 | Regression | 37.766 | 7 | 5.395 | 110.466 | .000b |
| Residual | 14.505 | 297 | .049 | |||
| Total | 52.271 | 304 | ||||
From Table 14, it is identified that the value of F- stat is 110.466 and is significant as the level of significance is less than 5℅ (P < 0.05). This indicates that the overall model was reasonable fit to proceed to the next regression coefficient model (Table 15). The relative importance of the significant predictors is determined by looking at the standardized coefficients. The use of a regression with standardized coefficients has an advantage over that with the unstandardized or OLS coefficients in that, in the former, the explanatory variables are put on an equal footing. Therefore, explanatory variables with higher standardized coefficients contribute more significantly to the dependent variable. The results of multiple regressions in the Table 4 above indicate that tangibility has the highest value (β=0.281), at 99 percent confidence level (P <0.01), which means that tangibility is the best predictor or makes the greatest contribution to the customer satisfaction and the second predictor to customer satisfaction is corporate image with a beta value (β=0.260), at 99 percent confidence level (P < 0.01, followed by assurance with a beta value (β=0.252), at 99 percent confidence level (P < 0.01), core hotel benefits with a beta value (β=0.178), at 99 percent confidence level((P < 0.01) and responsiveness with a beta value (β=0.153), at 99 percent confidence level (P < 0.01), except reliability and empathy that lack statistical significance. As indicated in the Table 4, service quality dimensions (tangibility, assurance, responsiveness, corporate image, and core hotel benefits) have positive and significant effect on customer satisfaction. The remaining dimensions (empathy and reliability) have positive and insignificant effect on customer satisfaction. As a result H1, H3, H5, H6 and H7 are accepted where as H2 and H4 are rejected in this study. This finding is the same with Veasna 2013 who studied the six dimensions of service quality (tangibility, responsiveness, core hotel benefits, reliability, assurance and empathy) and found that these dimensions have a significant and positive impact on the overall customer satisfaction of hotel guests, with tangibility dimension being the most important predictor of hotel guest satisfaction and with several studies of.
| Model | Unstandardized Coefficients | Standardized Coefficients | T | Sig. | Co-linearity Statistics | |||
|---|---|---|---|---|---|---|---|---|
| B | Std. Error | Beta | Tolerance VIF | VIF | ||||
| (Constant) | -.382 | .129 | -2.960 | .003 | ||||
| Tangibility | .244 | .032 | .281 | 7.713 | .000 | .704 1.420 | 1.420 | |
| Reliability | .020 | .012 | .053 | 1.712 | .088 | .958 1.044 | 1.044 | |
| Empathy | .008 | .014 | .017 | .558 | .577 | .969 1.032 | 1.032 | |
| Assurance | .299 | .048 | .252 | 6.294 | .000 | .584 1.713 | 1.713 | |
| Responsiveness | .189 | .047 | .153 | 3.990 | .000 | .635 1.574 | 1.574 | |
| Corporate image | .234 | .038 | .260 | 6.231 | .000 | .538 1.858 | 1.858 | |
| Core hotel benefits | .143 | .029 | .178 | 4.849 | .000 | .696 1.437 | 1.437 | |
It is also supported by Fah & Kandasamy who studied to determine the impact of dimensions of service quality in Malaysia and found that service quality dimension of tangibility carries the heaviest weight in explaining customer satisfaction. This is also similar with the research which was conducted in Pakistan that tangibility was the most contributors for customer satisfaction from the other service quality dimensions. Moreover, a study was also conducted in Jordan that service quality dimensions of responsiveness, assurance, and reliability have positive impact on customer satisfaction.
Unlike this study, there have been other studies in which assurance takes the first place and other researchers found that empathy takes the first place. On contrary, the two service quality dimensions (reliability and empathy) have positive and insignificant effect on customer satisfaction. This means that these two service quality dimensions have no any predictor power or contribution on the variation of the dependent variable (customer satisfaction). Regarding to multi co linearity, it exists when two or more of the predictor variables in a regression model are highly correlated. Multi co linearity test was taken in this study with tolerance and VIF/variance inflation factor/ values. There is no multico linearity between two or more predictor variables when the tolerance value is greater than 0.1 and VIF is less than 10 respectively. Thus, as it can be shown in Table 13, the researcher concludes that there is no multi co linearity among independent variables. In addition, the assumptions of multiple linear regressions such as normality, linearity, and homoscedasticity were tested using the data which was collected from questionnaires using SPSS version 20 and the figures were attached at the back of the paper in the appendices part.
Summary of findings
This study aimed at identifying the effect of service quality on customer satisfaction in medium level hotels in Debre Markos town. The study targeted at customers of medium level hotels about their perception of the provided services. It also contains research questionnaire that states about whether customers are satisfied or not in the provided service quality given by hotels. Regarding to the dimensions of tangibility, customers were satisfied on the existence of modern looking equipments with mean score of 3.15 and were dissatisfied with the items of neatness and discipline of employees and clean lines of hotels’ rooms with the mean scores of 2.87 and 2.74 respectively. On the other hand, respondents were not satisfied with the item of uniforms’ attractiveness. As a result, since the mean score of tangibility dimension was 2.83, it showed that the majority of the customers were dissatisfied/disagree on the existence of attractive physical facilities in hotels.
Respondents were asked about the dimensions of reliability and they replied that they were dissatisfied with the item of fast service of the hotel with a mean score of 2.21. On the other hand, customers were satisfied with the items of employees’ courteous, effective handling of complaints, provision of accurate information and dependable handling of service problems with mean scores of 3.21, 3.52, and 3.19 respectively. These result indicated that employees were courteous in their behavior, solved the problem of some complaints on themselves and were willingness to give the accurate information to customers while staying in the hotels. The mean score (3.05) of the reliability dimension also showed that customers were satisfied with the provided service in hotels of DMT. Concerning to the dimension of responsiveness, respondents were also depicted that they were satisfied on the item of the behavior of service providers in the hotel with a mean score of (3.3). On contrast to the behavior of employees, respondents were dissatisfied with the items of hotels’ provision of diversified services, prompt service and quick response with the mean scores of 2.85, 2.78, and 2.90 respectively. The mean score of (2.94) indicated that customers were dissatisfied with the dimension of responsiveness in the hotel.
Respondents were also asked about the hotels’ employees’ friendly treatment manners, understanding of customers specific needs, treatment of customers with great respect and individual attention given for customers and they revealed that they were satisfied on the items of friendly treatment of employees and understanding of customers’ specific needs with the mean scores of (3.25) and (3.13) respectively. Meanwhile, the respondents were dissatisfied/disagree/ with the items of great respecting and individual attention given to customers with mean score values of 2.9 and 2.6 respectively. The four items mean score of 3.01 implied that customers were satisfied with the dimensions of empathy.
Similarly, respondents were also requested about the dimension of assurance and they replied that they were dissatisfied with the five items of employees’ skills, trust worthiness, confidential service and safe in their service with the mean scores of 2.73, 2.88, 2.67, 2.61and 2.85 respectively. As it is depicted, customers’ level of satisfaction was low or dissatisfied with the dimension of assurance in hotels of DMT. To understand the hotels’ overall impression or image of customers, respondents were requested and they described that they were satisfied with the hotels’ beautifully designed menu where as they dissatisfied on the five items of hotels’ promotion, good reputation, public and environmental protection activities and favor and patronage of celebrities with mean scores of 2.73, 2.87, 2.75 and 2.71 respectively. In addition, the mean score (2.8) of the dimension of corporate image indicated that customers’ level of satisfaction was low.
Moreover, the respondents were also asked about the core hotel benefits favor and given to guests/ customers and replied that they were satisfied with three items of quietness of rooms, comfortable and neatness of mattress, pillows, beds, sheets and covers and reasonable room rate of hotels with the mean scores of 3.2, 3.05, and 3.02 respectively. On the other hand, respondents were dissatisfied with the remaining items of comfortable, relaxed and welcoming feelings, provision of variety of basic products and services/ tooth paste, soap, shampoo towel, toilet paper and drinking water/ with the mean scores of 2.8 and 2.69 respectively. The mean score of (2.95) all items also indicated that customers were dissatisfied with the dimension of core hotel benefits. Respondents were also requested whether they were satisfied or not with various items which are related with customer satisfaction and they replied that they were dissatisfied with the five items of hotels’ complete range of service, performance of employees, employees’ competency, quick service of hotels, and respectful behavior of employees with mean scores of 2.9, 2.52, 2.56, 2.53 and 2.6 respectively. On contrary, customers were dissatisfied of being a client of hotels. Therefore, as the mean score (2.59) of items implied, the majority of customers were less satisfied. The correlation result also showed that service quality dimensions/ tangibility, corporate image, assurance, responsiveness and core hotel benefits) were positively and significantly related with customer satisfaction but reliability and empathy were positively and insignificantly related with customer satisfaction. The results of regression showed that the R value 0.85 implied that there is a strong relationship between the independent variables and dependent variables.
Moreover, adjusted R square value 0.716 indicated that the independent variables/ service quality dimensions/ accounted for 71.6℅ of the variance in customer satisfaction and the remaining 28.4 variations in customer satisfaction may be explained by other un explored variables. In addition, the ANOVA model showed that the value of F-stat is 110.66 and is significant as the level of significance (P < 0.05) so that the overall model was reasonable fit. Among the service quality dimensions, tangibility has the highest contribution to the customer satisfaction followed by corporate image, assurance, core hotel benefits and responsiveness respectively whereas reliability and empathy have no effect on customer satisfaction.
In this section, a list of recommendations has been presented based on the findings of the survey conducted on customers of medium level hotels in Debre Markos town.
For owners
● Regarding to the tangibility of hotels, customers were less satisfied with the neatness and disciplined of employees, rooms clearness and employees’ uniforms so that owners should due attention on the neatness and behavior of employees and provide the required uniforms and other materials necessary for the delivery of services.
● Owners should motivate employees by giving attractive salary and incentives to make them feel sense of ownership.
● Owners should promote their hotels on what they are doing and give different services to the customers using mass media (radio, magazines, TV etc..) to enable them create awareness and good image in the minds of the population and also should allow them participate on the public and environmental protection activities and support different celebrities which are carried out in the town.
● Concerning to responsiveness dimension of hotels, customers were satisfied with the willingness of employees to serve guests but they were less satisfied with the hotels’ diversified service, prompt service and quick response to customers so that owners should make hotels render so many services to customers to make them satisfied and competent with other similar organizations.
For managers
● Managers should give induction and orientation to their new recruited employees on how to deliver quick and prompt service to customers.
● Similarly, employees’ should be given the required skills and knowledge, trustworthiness and confident on their service, and also managers should give freedom and continuous training for their employees with the concerned bodies. Moreover, since hotels are customer oriented organizations, they should also employ/hire potential, self-motivated and enthusiastic employees.
● To be competent with the other similar organizations, managers should create conducive environment for the rest of guests and should also provide basic products and services such as tooth paste, soap, shampoo, towel and drinking water for the guests.
● In addition, managers should help business organizations adapt themselves with the volatile environment with their core competencies to be competent with other similar organizations and should know their unique strengths and keep it up for the achievement of their objectives and goals.
For employees
● Employees should deliver the required service with great patience, trustworthiness, confident and freely to the customers and should know that customers are the main source for the existence of hotels as well as their life. They should also feel as servant for customers rather than making them superior.
For policy makers
● To improve the service delivery of hotels, policy makers should prepare standardized rules and regulations on how to recruit manpower, standardized service quality standards, payment of employees in accordance with the level of hotels, disciplines and qualifications of employees and also their organizational structures in the country.
This study was conducted to identify the effect of service quality dimensions on customer satisfaction in medium level hotels in Debre Markos town so as to generalize the level of satisfaction. Hence, it is better for the fourth coming researchers to conduct comparative study among hotels with similar issue at hand so as to find out other factors that can affect customer satisfaction. Moreover, this study only included service quality dimensions, but there could be some other relevant variables that may be perceived as factors for customer satisfaction like organization’s service culture, employees’ related factors (attitudes, educational level, and motivation), management commitment, leadership styles and other variables which can influence customer satisfaction could be studied in the future.
Google Scholar, Indexed at, Crossref
Google Scholar, Indexed at, Crossref
Google Scholar, Indexed at, Crossref
Google Scholar, Indexed at, Crossref
Google Scholar, Indexed at, Crossref
Google Scholar, Indexed at, Crossref
Google Scholar, Indexed at, Crossref
Google Scholar, Indexed at, Crossref
Business and Economics Journal received 6451 citations as per Google Scholar report


