Research Article - (2024) Volume 13, Issue 3
Received: 20-Jan-2023, Manuscript No. JBFA-23-87782;
Editor assigned: 27-Jan-2023, Pre QC No. JBFA-23-87782 (PQ);
Reviewed: 13-Feb-2023, QC No. JBFA-23-87782;
Revised: 17-Apr-2023, Manuscript No. JBFA-23-87782 (R);
Published:
24-Apr-2023
, DOI: 10.37421/ 2167-0234.2024.12.468
Citation: Nelson, James M. "The Impact of Hedging on the Market Value of Equity: A New Look Through A New Sample." J Bus Fin Aff 12 (2024): 468.
Copyright: �?�© 2024 Nelson JM. This is an open-access article distributed under the terms of the creative commons attribution license which permits unrestricted use, distribution and reproduction in any medium, provided the original author and source are credited.
I use the Fama and French five-factor model to reexamine the seemingly anomalous result of Nelson, Moffitt, and Affleck-Graves, who document significant abnormal returns for firms that hedge. Applying the latest five-factor model on a new sample of U.S. firms from 2013-2021, I observe significant monthly abnormal returns of 0.274% (3.34% annually) for firms using derivative securities (hedgers). Additional analysis shows mixed results regarding the economies of scale and managerial sophistication hypotheses that predict any abnormal returns from hedging should be confined only to large firms.
Hedging • Derivatives • Multifactor models • Return anomalies • Redundant
Fama and French introduce a five-factor asset pricing model that is more robust in explaining stock returns than either the Fama or French three-factor or Carhart four-factor models. They contend that the value/growth factor in their original three-factor model is a noisy proxy for expected returns since the market value also responds to forecasts of earnings and investment. Their five-factor model adds factors based on the level of profitability (RMW) and investment (CMA) and they contend that these new factors capture the exposure of the value/growth factor, making the HML factor redundant. While they acknowledge their five-factor model has trouble capturing the returns on small stocks whose returns act like those of firms that invest a lot despite being unprofitable, overall, their five-factor model outperforms the three-factor model. Fama and French contend the five-factor model’s success comes from its ability to capture the effects of profitable firms that invest conservatively and unprofitable firms that invest aggressively. Based on this ability, they show their five-factor model helps explain several important return anomalies (share repurchases, large share issuances, low/high beta stocks, low/high volatility stocks) that have avoided explanation by their three-factor model.
One such potential anomaly might be found in Nelson, Moffitt, and Affleck-Graves, who find significant abnormal returns in a sample of U.S. firms that use derivative securities (hedge). Specifically, using the Fama and French (Carhart) four-factor model, they document significant monthly abnormal returns of 0.35% (4.3%annually) for all hedgers, 0.42% (5.1% annually) for currency hedgers, and 0.96% (12.2% annually) for firms that hedge only currencies and not interest rates or commodities. This result was shown to be robust across multiple asset pricing models and methodologies. Consistent with the economies of scale and managerial sophistication hypotheses, the abnormal returns for currency hedgers were shown to be primarily driven by larger firms [1].
Fama suggests that “most long-term anomalies tend to disappear with reasonable changes in technique” and that “some anomalies do not stand up to out of sample replication.” While the results of Nelson, et al. are robust across multiple asset pricing models and methodologies, the Fama and French five-factor model was not an available methodology at the time of publication. Additionally, recent accounting standards updates require US firms to disclose offsetting asset and liabilities positions in derivative securities. Beginning in September of 2013, these derivative data have been aggregated and reported the S and P Compustat database, which allows us to conduct an out of sample test of Nelson, et al. results on an entirely new sample of US firms. This allows us to reexamine their hedging anomaly employing the five-factor methodology of Fama and French on a new sample of US firms.
Nelson, et al. sample was collected during the short window where the Financial Accounting Standard Board’s (FASB) Statement of Financial Accounting Standard (SFAS) No. 119-disclosure about derivative financial instruments and fair value of financial instruments was in force. SFAS No. 119 required firms to disclose the amount, nature, and terms of derivative financial instruments and to differentiate between derivatives held for trading purposes or purposes other than trading. SFAS No. 119 was superseded by SFAS 133 accounting for derivative instruments and hedging activities which, for firms with “qualified” hedging activities, eliminated the detailed disclosures required under SFAS No. 119 that were necessary to construct their hedging sample. Essentially these changes in accounting standards made an out of sample replication and test impossible, until FASB issued Accounting Standards Update (ASU) 2011-11 as revised and updated by ASU 2013-01, which, among other changes, required firms to disclose offsetting asset and liability positions in derivative securities. Beginning in September 2013, S and P Compustat began aggregating and reporting across derivative types for both current and long-term derivative assets and liabilities. While these variables allow us to identify “hedgers” and “non-hedgers,” because of the aggregation used by S and P Compustat to construct these variables, I am unable to identify the exact types of hedging activity each firm is engaging in (currency, interest rate, commodity) [2].
I make every effect to follow Nelson et al. in our sample construction process. I begin by selecting all US incorporated firms from the Compustat Capital IQ North American fundamentals annual database with fiscal year ends from September 2013 through December 2020 having non-missing total assets. Utilities (Sic codes 4900-4999) and financials (Sic codes 6000-6999) are removed.
This sample is then matched with the Center for Research in Security Prices (CRSP) database where all securities other than common stocks (CRSP share codes 10 and 11) are removed. The resulting sample consists of 2,978 unique firms with 17,693 firm/year observations. Firms in the sample reporting non-zero values for the compustat variables gains/losses on derivatives and hedging (DERHEDGL) or Comprehensive Income-Derivative Gains And Losses (CIDERGL) are identified as using derivatives (“hedgers”) for the current fiscal year. Firms reporting non-zero values for Derivative Assets-Current (DERAC), Derivative Assets-Long Term (DERALT), Derivative Liabilities Current (DERLC), or Derivative Liabilities-Long Term (DERLLT) are identified as using derivatives (“hedgers”) for both the current and next fiscal year [3].
I partitioned the sample by industry using the four-digit historical SIC code, placing them into the Fama and French 17 industry classifications. Since both utilities and financials were previously dropped from the sample, I am left with 15 unique industry groupings. Information of the mean and median market value of equity for both derivative and non-derivative users by industry grouping is reported in Table 1. The results presented in Table 1 consistently show, with the exception of the oil industry, that firms that hedge tend to be significantly larger than their non-hedging counterparts. These results are consistent with those reported in Table 1 of Nelson, et al.
| Industry | Firms using derivatives | Firms not using derivatives | P-Value on test of differences |
|---|---|---|---|
| Food | 21,902.43 | 1,229.69 | 0.0001 |
| (7,361.51) | (418.85) | 0.0001 | |
| (317) | (233) | ||
| Mines | 5,272.27 | 1,228.33 | 0.0001 |
| (1,110.41) | (212.25) | 0.0001 | |
| (175) | (90) | ||
| Oil | 10,489.26 | 17,185.95 | 0.0001 |
| (1,708.33) | (231.50) | 0.0001 | |
| (537) | (190) | ||
| Clothes | 9,320.07 | 2,229.34 | 0.0001 |
| (2,741.20) | (398.66) | 0.0001 | |
| (169) | (108) | ||
| Consumer Durables | 3,183.36 | 1,132.59 | 0.0001 |
| (1,304.62) | (187.89) | 0.0001 | |
| (222) | (187) | ||
| Chemicals | 5,975.03 | 1,146.83 | 0.0001 |
| (2,698.52) | (408.92) | 0.0001 | |
| (332) | (129) | ||
| Drugs, soap, tobacco | 35,183.47 | 3,084.66 | 0.0001 |
| (1,599.74) | (252.74) | 0.0001 | |
| (387) | (604) | ||
| Construction | 8,399.81 | 2,609.12 | 0.0001 |
| (2,145.31) | (663.00) | 0.0001 | |
| (348) | (358) | ||
| Steel works | 2,936.01 | 706.83 | 0.0001 |
| (1,685.52) | (395.37) | 0.0001 | |
| (125) | (78) | ||
| Fabricated products | 4,724.50 | 990.90 | 0.0001 |
| (2,184.88) | (521.22) | 0.0001 | |
| (103) | (75) | ||
| Machinery and business equipment | 11,151.82 | 3,018.49 | 0.0001 |
| (2,817.99) | (228.33) | 0.0001 | |
| (1,266) | (1,190) | ||
| Automotive | 11,159.90 | 5,096.25 | 0.1120 |
| (2,870.85) | (851.42) | 0.0001 | |
| (233) | (125) | ||
| Transportation | 15,266.83 | 8,554.30 | 0.0006 |
| (3,136.85) | (1,243.94) | 0.0001 | |
| (339) | (379) | ||
| Retail stores | 23,871.60 | 9,815.18 | 0.0008 |
| (3,556.55) | (636.84) | 0.0001 | |
| (317) | (676) | ||
| Other | 18,632.51 | 2,706.39 | 0.0001 |
| (1,687.64) | (458.32) | 0.0001 | |
| (2,975) | (5,289) | ||
| All firms | 15,302.69 | 3,679.83 | 0.0001 |
| (2,196.13) | (426.68) | 0.0001 | |
| (7,845) | (9,711) | ||
| Notes: Reported p-values are the result of T-test on the differences in means and Wilcoxon two sample test on the medians. N in (). | |||
Table 1. Mean (median) market value of equity in millions USD from 2013 through 2020 by industry.
More detailed information on the percentages of firms using derivatives can be found in Table 2. While it appears that the percentage of firms using derivatives declines slightly over our sample period, comparison of our results with those of Nelson, et al. shows that the percentage of firms hedging has increased overall since the time of their sample. For example, they report, 72.34%, 51.86%, and 33.18% of firms in the S and P 500, S and P mid cap, and S and P small cap indices using derivatives compared to 77.56%, 59.38%, and 47.41% for our sample respectively. Similar patterns can be observed for groups formed by industry and market value of equity quartiles. In general, our results are consistent with the overall level of consolidation and IPO trends in the US equity markets over the past two decades [4].
| Sample grouping | N | Firms using derivatives (%) | Firms not using derivatives (%) | Industry grouping | N | Firms using derivatives (%) | Firms not using derivatives (%) |
|---|---|---|---|---|---|---|---|
| Year | |||||||
| 2013 | 1,394 | 49.21% | 50.79% | Food | 558 | 56.99% | 43.01% |
| 2014 | 1,935 | 46.72% | 53.28% | Mines | 265 | 66.04% | 33.96% |
| 2015 | 2,050 | 46.05% | 53.95% | Oil | 730 | 73.70% | 26.30% |
| 2016 | 2,144 | 44.87% | 55.13% | Clothes | 278 | 60.79% | 39.21% |
| 2017 | 2,276 | 44.46% | 55.54% | Consumer durables | 413 | 54.00% | 46.00% |
| 2018 | 2,448 | 43.67% | 56.33% | Chemicals | 462 | 72.08% | 27.92% |
| 2019 | 2,606 | 41.63% | 58.37% | Drugs, soap, tobacco | 995 | 38.99% | 61.01% |
| 2020 | 2,840 | 42.85% | 57.15% | Construction | 709 | 49.22% | 50.78% |
| Index | Steel works | 203 | 61.58% | 38.42% | |||
| S and P 500 | 2,603 | 77.56% | 22.44% | Fabricated products | 180 | 57.22% | 42.78% |
| S and P mid cap | 1,950 | 59.38% | 40.62% | Machinery and business equipment | 2,468 | 51.42% | 48.58% |
| S and P small cap | 3,012 | 47.41% | 52.59% | Automotive | 360 | 65.28% | 34.72% |
| MVE size quartiles | Transportation | 720 | 47.22% | 52.78% | |||
| First (largest) | 4,421 | 70.26% | 29.74% | Retail stores | 1,012 | 31.82% | 68.18% |
| Second | 4,425 | 49.06% | 50.94% | Other | 8,340 | 35.88% | 64.12% |
| Third | 4,422 | 32.25% | 67.75% | ||||
| Fourth (smallest) | 4,425 | 26.58% | 73.42% | All firms | 17,693 | 44.53% | 55.47% |
| Note: Following Nelson, et al. firms are placed into the Fama-French 17 industry classifications (excluding utilities and financials). Size quartiles are calculated annually using data from the CRSP. | |||||||
Table 2. Percentage of sample firms that hedge by year, S and P index, size quartile, and industry.
I carefully follow the methodology used by Nelson, et al. in setting up our calendar time portfolios. When a firm has been identified as using derivatives during the firm’s fiscal year, I classify that firm as a hedger for all 12 months of that fiscal year. I then use these classifications to construct monthly calendar-time portfolios that capture the value weighted return for a portfolio that invests in the stock of every company that engages in hedging activity, for every month of every fiscal year for which they are identified as having used derivatives. I compute the excess return on these monthly value-weighted hedging portfolios by subtracting risk-free rate, yielding RPt–Rft, which is then used as the dependent variables in the following regressions:
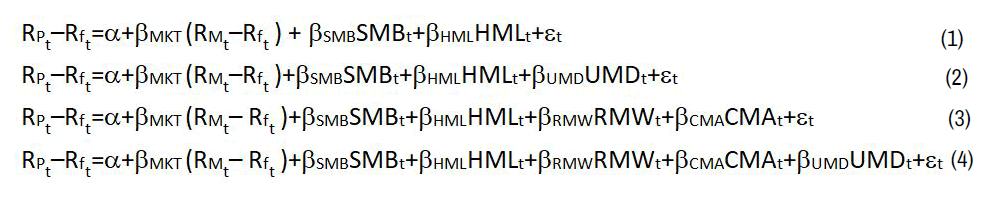
Where RMt–Rft is the market excess return factor, SMB is a size factor calculated as the return on portfolios of small firms minus big firms, HML is a value/growth factor calculated as the return on portfolios of high book to market firms minus low book to market firms, RMW is a profitability factor calculated as the return on portfolios with robust profitability minus weak profitability, CMA is an investment factor calculated as the return on portfolios of firms with conservative levels of investment minus aggressive levels of investment, and UMD is a momentum factor calculated as the return on portfolios of firms with high prior returns (up) minus firms with low prior returns (down). The intercept term (α) in each of these regressions is the primary variable of interest since it provides a measure of the monthly abnormal performance. All of the factors used in this study were downloaded from Ken French’s website [5].
Results for the various Fama and French regressions are summarized in Table 3. In all cases the monthly regressions are run over the period from October 2012 through December 2021. For each month, the dependent variable is calculated as the excess return on a value weighed portfolio consisting of all firms identified as using derivative securities during that month. The intercept terms in these regressions, therefore, provides an estimate of the abnormal returns accruing to firms using derivatives [6].
| Panel A: Fama and French three factor regressions with and without momentum factor | ||||||||
|---|---|---|---|---|---|---|---|---|
| Intercept | Rm-Rf | SMB | HML | UMD | Adj R2 | |||
| Coefficient | Std error | |||||||
| 0.00316 | 0.00105 | 1.00645 | -0.04799 | -0.0761 | 0.9347 | |||
| (0.0033) | (0.0001) | (0.2511) | (0.0203) | |||||
| 0.00327 | 0.00106 | 0.99778 | -0.0516 | -0.0937 | -0.03211 | 0.9346 | ||
| (0.0026) | (0.0001) | (0.2199) | (0.0144) | (0.3640) | ||||
| 0.00274 | 0.00099 | 1.00943 | 0.02192 | -0.15504 | 0.15011 | 0.19517 | 0.9424 | |
| (0.0068) | (0.0001) | (0.6313) | (0.0001) | (0.0110) | (0.0054) | |||
| 0.0028 | 0.00101 | 1.00578 | 0.01823 | -0.1619 | 0.14621 | 0.19403 | -0.01516 | 0.9420 |
| (0.0064) | (0.0001) | (0.6956) | (0.0002) | (0.0146) | (0.0059) | (0.6534) | ||
| Note: The dependent variables in these regressions are the monthly value weighted excess portfolio returns from October 2012 through December 2021 for firms identified as using derivatives. P-values in (). | ||||||||
Table 3. Results of Fama and French regressions on firms that hedge.
The results presented in Table 3 for the Fama and French four-factor model are surprisingly close to those reported in the original study. For all hedgers, they reported monthly abnormal returns of .352% (p-value 0.0954), while I document a similar value of .327% (p-value 0.0026). The advantage of our longer sample window in terms of reduced standard errors in our regressions is evident in our lower p-values. In examining the results using the Fama and French five-factor models, Nelson note that the additional factors seem to explain a small portion of the abnormal returns. It is interesting to note that both the profitability (RMW) and investment (CMA) factor loadings were significant in the both regressions (with and without momentum), however the value/growth factor was not redundant in these regressions with the HML factor loadings being highly significant. Even using the improved methodology of the Fama and French five-factor model, firms using derivatives still exhibit significant positive abnormal returns of .274% per month (p-value 0.0068). This compounds to an annual abnormal return of 3.34% for firms that hedge [7].
As observed in Tables 1 and 2, larger firms are more likely to use derivatives (hedge) and consistent with the economies of scale and managerial sophistication hypotheses Nelson, et al. show that abnormal returns for currency hedgers were primarily driven by larger firms (as measured by total assets). To examine this relationship further, I divide derivative using firms into large and small hedgers using the annual median value of total assets for the sample of firms using derivatives. This process provides for an equal number of small and large hedgers for each year in the sample. Nelson then run the various Fama and French regressions on both the large and small hedging samples, the results of which are presented in Table 4.
| Firm | Intercept | Rm-Rf | SMB | HML | RMW | CMA | UMD | Adj R2 | |
|---|---|---|---|---|---|---|---|---|---|
| Size | Coefficient | Std error | |||||||
| Large hedgers | 0.00278 | 0.00109 | 1.00635 | -0.08976 | -0.07402 | 0.9314 | |||
| (0.0123) | (0.0001) | (0.0394) | (0.0290) | ||||||
| 0.00292 | 0.00110 | 0.99575 | -0.09418 | -0.09557 | -0.03927 | 0.9296 | |||
| (0.0090) | (0.0001) | (0.0315) | (0.0157) | (0.2831) | |||||
| 0.00232 | 0.00103 | 1.00993 | -0.01443 | -0.15605 | 0.16044 | 0.20344 | 0.9381 | ||
| (0.0258) | (0.0001) | (0.7596) | (0.0003) | (0.0086) | (0.0050) | ||||
| 0.00241 | 0.00104 | 1.00462 | -0.01981 | -0.16022 | 0.15476 | 0.20179 | -0.02204 | 0.9378 | |
| (0.0224) | (0.0001) | (0.6802) | (0.0004) | (0.0123) | (0.0055) | (0.5270) | |||
| 0.01189 | 0.00152 | 1.00895 | 0.84487 | -0.09585 | 0.9202 | ||||
| (0.0001) | (0.0001) | (0.0001) | (0.0417) | ||||||
| 0.01143 | 0.00149 | 1.04341 | 0.85925 | -0.02576 | 0.12773 | 0.9221 | |||
| Small hedgers | (0.0001) | (0.0001) | (0.0001) | (0.6266) | (0.0110) | ||||
| 0.01230 | 0.00159 | 1.00547 | 0.77997 | -0.22838 | -0.11508 | 0.03010 | 0.9111 | ||
| (0.0001) | (0.0001) | (0.0001) | (0.0004) | (0.2167) | (0.7840) | ||||
| 0.01178 | 0.00156 | 1.03804 | 0.81296 | -0.16701 | -0.08023 | 0.04026 | 0.13524 | 0.9157 | |
| (0.0001) | (0.0001) | (0.0001) | (0.0118) | (0.3808) | (0.7068) | (0.0108) | |||
| Note: The dependent variables in these regressions are the monthly value weighted excess portfolio returns from October 2012 through December 2021 for firms identified as using derivatives. For the sample of firms identified as using derivatives, the median book value of assets is calculated for each year of the sample and firms falling above the median are classified as “large” hedgers with the remaining firms classified as “small” hedgers. P-values in (). | |||||||||
Table 4. Results of Fama and French regressions on large and small hedging firms.
The results for large hedgers presented in Table 4 are generally consisted with those of Nelson, et al. While their four factor results show an insignificant intercept of .00158, our regression shows a significant intercept of .00292 (p-value of 0.0090).
I also observe significant, albeit slightly smaller intercepts for large hedgers in the five-factor model regressions. The surprising results come from our examination of small hedgers. For small hedgers, across all models, I observe intercepts in excess of 1% significant at the 0.0001 level. Of particular interest in these regressions is the rather large factor loadings on SMB, which leads us to the acknowledgement by Fama and French of the problem with the five-factor model having trouble capturing the returns on small stocks whose returns are like those of firms that invest a lot despite being unprofitable. Regardless, I know their models are thought to work well for large firms, and I still have documented significant positive abnormal returns for large hedgers from anywhere from .232% to .292% per month. It is also important to note that Nelson et al.’s strongest result was for firms using only currency derivatives (not interest rate or commodity derivatives). This is an important observation, since larger firms may be more likely to use multiple types of derivatives [8].
Employing the latest five factor asset pricing model from Fama and French on an entirely new sample of US firms that use derivatives, I reexamine the hedging anomaly first documented by Nelson, et al. and document that firms using derivative securities (hedgers) continue to exhibit significant positive abnormal returns ranging from .274% to .327% per month. At a minimum these abnormal returns compound to 3.34% annually, indicating that the results of Nelson, et al. appear to hold up to out of sample testing. When I divided the sample into large and small hedgers, one surprising result was the magnitude of the intercepts for the small hedgers, with all models showing significant abnormal returns of over 1% per month. This result could be driven by the presence of a large number of “pure currency hedgers” that were shown to drive the abnormal returns in Nelson, et al., the result could be driven by a bad model problem with the Fama and French five factor model not capturing returns on small firms, or some combination of both of these.
While the evidence is clear that derivative users continue to exbibit significant abnormal returns, because of Compustat’s aggregation across derivative types (currency, interest rate, and commodity) in the calculation of their derivative asset and liability variables, I cannot determine whether these abnormal returns are driven by currency or “pure” currency hedgers as in Nelson, et al. An area for future research would be to examine this question by hand collecting data about the specific types of derivatives used by firms from the text of the financial disclosures in the 10-K annual filings of the 7,845 firms identified as using derivatives. Future research could also apply additional asset pricing models and tests of long run abnormal returns to verify the robustness of the results presented in here.
None
Journal of Business & Financial Affairs received 1726 citations as per Google Scholar report