Research - (2022) Volume 11, Issue 10
Received: 02-Oct-2022, Manuscript No. idse-22-76780;
Editor assigned: 03-Oct-2022, Pre QC No. P-76780;
Reviewed: 16-Oct-2022, QC No. Q-76780;
Revised: 17-Oct-2022, Manuscript No. R-76780;
Published:
24-Oct-2022
, DOI: 10.37421/2168-9768.2022.11.350
Citation: Dwivedi, Anuj Kumar, C.S.P. Ojha and Vijay P. Singh.
“Wheat Yield Modelling in Selected Agro-Climatic Zones of India.” Irrigat Drainage
Sys Eng 11 (2022): 350.
Copyright: © 2022 Dwivedi AK, et al. This is an open-access article distributed
under the terms of the Creative Commons Attribution License, which permits
unrestricted use, distribution, and reproduction in any medium, provided the
original author and source are credited.
The Indian economy depends on agriculture, and wheat is one of the most important grains of the country. The northern states of India, like Punjab, Haryana, Madhya Pradesh, Rajasthan, Uttar Pradesh, and Uttarakhand contribute a lot to the production of wheat but they lie in different agro-climatic zones. Climatic parameters greatly impact agricultural productivity. Using agro-meteorological and satellite parameters, the present study develops regression models for predicting crop yield in three different agro-climatic zones of India. Remote sensing approaches are being increasingly utilized these days. The present study develops a wheat yield models using the Normalized Difference Vegetation Index (NDVI) as well as agro meteorological data like rainfall, temperature, and humidity for the districts of Allahabad, Haridwar, and Ludhiana in the states of Uttar Pradesh, Uttarakhand and Punjab, respectively. It also deals with the development of models to forecast crop yield based on only agro meteorological and NDVI based agro meteorological models three times during the crop period. The maximum NDVI, maximum temperature, minimum temperature, rainfall, and humidity data of 21 years were considered as an input variable to develop a regression model for the districts of Allahabad, Haridwar, and Ludhiana. Comparison of several approaches indicated the better performance of coupled crop yield model which utilized NDVI and hydro-meteorological data simultaneously. Further, models using other temperature indices were also evaluated for their effectiveness over conventionally used temperature terms.
Wheat • Regression • Agro-climatic zones • NDVI • Google Earth engine
Wheat yield forecasting is relevant to policymakers, as it can assist in decision making related to import or export. It can also lead to better planning during drought years to stock grains. Therefore, it is important to develop models which can forecast wheat yield. There are a wide variety of crop models but one needs to identify a specific model suitable for a given site. Some of the models related to wheat are summarised in Table A1 (see Appendix). These crop models can be grouped into three categories. In the first category, models consider the use of agro meteorological parameters to relate with crop yield. For example, according to Skees JR [1]. The time duration of the national drought insurance program can be increased by using a rainfall-dependent yield model. The agro-meteorological parameters like rainfall, temperature, and relative humidity have much impact on crop yield. The crop yield is affected by a change in climatic conditions [2-5].
Crop yield is also affected by soil property which causes the variation in yield production [6,7]. Meteorological as well as agro meteorological parameters are widely used to predict crop yield in different ways [8-10]. Thus, during the forecasting of crop yield, soil properties, canopy temperature, precipitation, and agro-meteorological data are dominant parameters [11-14]. Climatic variables also feature in the Miami Model, Thorn Thwaite model, and Chicago Model [15]. Thorn Thwaite models gave better results when these models were compared to each other [16] However, one cannot overlook the management of agriculture practices which can play an important role during the whole season [14,17].
In the second group of models, the emphasis is on the use of NDVI, which is an important variable in a crop yield model. Crop modeling is governed by weather factors, such as rainfall, temperature, and humidity, which play an important role in the development of plant growth. At any stage, NDVI can indicate the health of plant characterized by the growth of leaves and stemthe ultimate growth signature in NDVI. NDVI may also indirectly represent the influence of rainfall, humidity, wind speed, temperature, sunshine hours, etc. which influence the productivity, development, and growth of crops [18].
In the third category, investigators have used both NDVI and meteoroidal variables. For wheat crop, some of the models in the above three categories are summarized. These models are based on the work done in India as well as other countries. It is recognized that only some of the models have been listed here just to indicate the direction of the previous research. External factors like
| District Name | Model Name | Yield Model | R2 |
|---|---|---|---|
| Allahabad | NDVI(60) | Yield (tha-1) =7.94×NDVI60 -0.1628 × Rainfall (mm) - 0.021 × Min.Temp(℃)+0.034 × Max.Temp (℃) + 0.0079 × RH (%) - 0.0193 |
0.8175 |
| NDVI(90) | Yield (tha-1) = 5.0046×NDVI 90 -0.1139 × Rainfall (mm) -0.0561× Min.Temp(℃) + 0.079 × Max.Temp(℃) +0.0139 × RH (%)- 0.9818 |
0.8797 | |
| NDVI(max) | Yield (tha-1) = 4.9160 × NDVImax - 0.0779 × Rainfall(mm) -0.0105×Min.Temp(℃)+0.0270 ×Max.Temp(℃) +0.0028×RH(%)-0.4661 |
0.9010 | |
| NDVI(max)T1T2 | Yield (tha-1) = 5.24×NDVImax - 0.02 × Rainfall (mm) - 35.88 ×T1(℃)-3.28×T2 (℃) + 0.024 ×RH (%) + 39.122 |
0.9183 |
soil variety, weather conditions, and technology adopted during the crop period may also affect crop yield. Measuring these factors in the relationship of crop yield is important [19,20].
The crop yield modeling is mostly based on statistical methods that are associated with the past yield data and weather inputs. Crop yield prediction in the respective season should be done with more priority than climatic change prediction [21]. Agricultural productivity of any place is often concerned with the study of its climatic condition, which affects its productivity and its growth [22]. Agricultural productivity increases when rainfall rises, but the temperature rise is harmful to particular seasonal crops [23]. It is difficult to accurately predict the yield of any crop at mid-season and maturity [24,25]. To validate models requires field experiments which take time and money. There is a lack of data during the validation of models in both space and time [26,3]. A weather inputbased crop model provides real-time yield. The crop model, incorporating biophysical indices, spectral indices, agro meteorological indices, estimate crop yield well [27,28].
The model developed, based on the weighted rainfall index, is used to forecast wheat yield [29]. Many studies done in India and other countries28 forecast crop yield using Agro meteorological data [30-38]. This study aims at developing crop yield models using three modelling approaches, as described above. As a departure from the earlier studies, this study also looks into the ability of these models in forecasting maturity yield at different stages of crop growth. The time after sowing is considered as 60, 90, and 120 days at which the performance of these models is evaluated. To gain better insights into the potential of these models, three districts in different states of India under different climatic zones are considered. The work is organized as follows. In section 2, details of the study area are given, followed by a section on data used, the source from where this data is collected and certain properties of it in terms of maximum and minimum values are listed. In section 4, the models used in this study are elaborated and in the next section on methodology, the steps used in the calibration of these models are described on. The performance of various regression models is described to identify their potential in each study area. Finally, conclusions are inferred.
Details of three districts lying in different states are as shown in Figure 1 are summarized here.
Allahabad
Allahabad district is located in the state of Uttar-Pradesh in Agro-climatic zone 4, as per a report issued by the planning commission, Government of India. It lies between the latitude of - 25043’05"N to 25037’18"N and longitude of 81053’37” E to 82006’09” E. The elevation of the study area is 5482 sq. km with an elevation of 104 m above MSL. The annual rainfall is around 1027 mm. The maximum and minimum temperature are about 46 and 9℃, respectively. The Allahabad district is identified as the most populated district of the state and the 13th most populated district of the country. According to census 2011, the population of the district is around 60 million. The Allahabad district is also known for Triveni/Sangam, where the rivers Ganga, Yamuna, and Sarasvati meet each other. Also, this city is well known as a pilgrimage of Hinduism. Wheat and Rice are common crops in this district. Wheat is grown in winter (November to September), while Rice is grown in monsoon (July to October) every year. In the local language, these crops are grown during the Rabi and Kharif seasons, respectively (Figure 1).
Haridwar
Haridwar district is located in the state of Uttarakhand in the agro-climatic zone 5. It is an important district of Uttarakhand in the agriculture sector because most of the areas in the state are hilly. It lies between latitude- 30006’35"N to 29049’31"N and Longitude-77052’57” E to 78011’49” E with an elevation of 314 m above MSL and has an area of 2360 sq. km. Crops are grown in three distinct seasons in humid and sub-humid climates. The summer season (September-May) is called Zaid, the Monsoon season (June- September) is called Kharif, and the crop grown in the winter season (October- March) is called Rabi crops. The annual rainfall of the district is 1074 mm, and the district receives 84% in monsoon season (June-September) and 16% in non-monsoon season. Holy River Ganga is the mainstream flowing in the district. The flood plain zone of the district is called Tarai and this is 15% area of the district. Soil found in the district is fertile and rich in clay and organic matter. Good soil is distributed in 80% of the area in the district.
Ludhiana
Ludhiana district is located centrally in the state of Punjab in agroclimate zone 6. It lies within the latitude-30048’57"N to 31004’47"N and longitude-75047’45” E to 75044’08” E with an elevation of 256 m above MSL having an area of 3767 sq. Km. The district receives 809.3 mm of rainfall annually. The most amount of precipitation occurs in monsoon seasons. Wheat, rice, and maize are major crops in the district which are sown in Rabi, Kharif, and Zaid, respectively. According to the Ministry of Agriculture, Government of India, Ludhiana is the highest wheat yield district of the country
Data used
Wheat yield data: The wheat yield data was obtained from the website of the Bureau of Economics and Statistics (BES), Ministry of Agriculture, Government of India. Wheat acreage, production, as well as yield are freely available to download. The data used in the study area of Allahabad, Haridwar, and Ludhiana were downloaded from the site year 1997 to 2018. The data were downloaded from the website.https://aps.dac.gov.in/APY/Public_Report1.aspx
Figure 2 shows the yield has varied at different sites. The yield in Allahabad is relatively lower than that at Haridwar and Ludhiana. The yield at Haridwar is slightly above Allahabad and Ludhiana has the highest yield potential within the three districts.
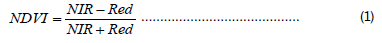
Normalized difference vegetation index (NDVI): It is a unit less index that lies between -1 to +1 and is derived from MODIS satellite data. The data was downloaded from the website of Google Earth Engine. Moderate Resolution Imaging Spectrometer (MODIS) data were acquired using the coordinates of the study area. Data from the web link (https://code.earthengine.google.com/) was exported in CSV format.
The variation of NDVI at a different stage like 60, 90 days and maturity is also shown along with wheat yield for three districts in Figure 2b. Needless to say, that pattern is similar to what is shown in Figure 2a. Higher yields are associated with higher values of NDVI.

Figure 1. Study area showing in different agro-climatic zones (Allahabad, Haridwar, Ludhiana).

Figure 2. (a) Wheat yield for study area from 1997-2018 and (b) NDVI variation of the study area from 1997-2018.
Agro met data: The weather data set for the concerned period 1997- 2018 was obtained from the website (https://power.larc.nasa.gov/data-accessviewer/) of the National Aeronautics and Space Administration (NASA). The required agro-met data like rainfall (mm), minimum and maximum temperatures (℃) and relative humidity (%) are available on the website of the National Aeronautics and Space Administration (NASA).
The plot of rainfall during the crop period is shown in Figure 3 for three districts. In Allahabad, rainfall is less as was the case with the yield. However, rainfall is highest at Haridwar; yet the yield is lesser than that in Ludhiana. Thus, based on rainfall alone, one cannot infer that the yield is proportional to rainfall. Similarly, a plot of minimum temperature is also shown in Figure 3. However, any explicit linkage between yield and minimum temperature is not evident. The same holds true for the plots shown in Figure 4 for maximum temperature and relative humidity.
The methodology can be best described in two parts: (A) and (B). In part A, the focus is on the development of NDVI based models. The maximum value of NDVI is considered in three time periods, i.e. 60, 90, and the entire crop period, also known as the maturity period. The intention here is to see whether reliable crop yield forecasts can be made at different lead times. In each of the two parts A and B, several strategies are used. Details of these strategies are as follows: with a p=value <0.05 were considered in the final multivariable logistic regression model to determine significance of the association with the outcome variable knowledge of sexually transmitted infections. The Hosmer-Lemeshow goodness-of-fit test was good enough to fit the data well because the” model indicated P = 0.755.
NDVI based model
Strategy A based on NDVI (60) model: In this model, crop yield was regressed with NDVI, rainfall, temperature, and relative humidity at 60-day duration of wheat crop of each district. The R2 value was calculated for each district.
Strategy B based on NDVI (90) model: In this model, crop yield is to be regressed with NDVI, rainfall, temperature, and relative humidity at 90-day duration of wheat crop of each district.
Strategy C based on NDVI (max) model: In this model, crop yield is related to NDVI, rainfall, temperature, and relative humidity at maturity of wheat crop of each district.
Strategy D based on NDVI (max)T1T2 model: In this model, crop yield depends on NDVI, rainfall, temperature, and relative humidity at maturity of wheat crop of each district, including T1 and T2 in place of minimum and maximum temperatures. T1 and T2 are two temperature dependent terms introduced by Bastiaanssen GMW [39].
Without the NDVI based model
Strategy E based on (RF+T+RH) 60 model: In this model, crop yield is related to rainfall, temperature, and relative humidity at 60-day duration of wheat crop of each district. The R2 value was calculated for each district.
Strategy F based on (RF+T+RH) 90 model: In this model, crop yield is regressed with rainfall, temperature, and relative humidity at 90-day duration of wheat crop of each district. The R2 value was calculated for each district.
Strategy G based on (RF+T+RH) max model: In this model, crop yield is assessed with rainfall, temperature, and relative humidity at maturity of wheat crop of each district. The R2 value was calculated for each district.
Strategy H based on (RF+T+RH) max. T1T2 model: In this model, crop yield is related to rainfall, temperature, and relative humidity at maturity of wheat crop of each district, including T1 and T2 in place of minimum and maximum temperature. The R2 value was calculated for each district. After the development of the models, the performance evaluation of some of the existing models was also done and is discussed.
The data was regressed with input variables like NDVI, rainfall, temperature, and humidity in different forms of the study area in various districts of India. The results are summarized in Table 1 for Allahabad, Table 2 for Haridwar, and Table 3 for Ludhiana, their relative performance is judged by the partial R2 amount between observed and predicted yields. Figures 5 and 6 show the R2 value between observed vs. predicted yields for Allahabad district with NDVI and without NDVI models, respectively, while Figures 7 and 8 for Haridwar and Figures 9 and 10 for Ludhiana compare observed and predicted yields using several strategies, as defined earlier.
Agreement between observed and predicted yields
Using several strategies, Figures 5-10 are presented. These figures also provide an insight into the relative performance of various regression models developed in the present work.
In this study the yield model was compared between observed and predicted yield with NDVI and without NDVI for the district of Allahabad in Figures 5 and 6. The lowest R2 value of 0.1209 was obtained for the district of

Figure 3. (a) Rainfall (mm) variation in the study area from 1997-2018 and (b) Minimum Temperature (°C) variation of study from 1997-2018.

Figure 4. (a) Maximum temperature (°C) variation for study area from 1997-2018 and (b) Relative humidity (%) variation in the study area from 1997-2018.
| District Name | Model Name | Yield Model | R2 |
|---|---|---|---|
| Allahabad | (RF+T+RH)60 | Yield(tha-1) =-0.1751× Rainfall (mm)-0.2273 × Min. Temp(â??) +0.2833 × Max. Temp (â??) + 0.0279 × RH (%) -3.7504 |
0.3663 |
| (RF+T+RH)90 | Yield (tha-1) = - 0.2625 × Rainfall (mm) - 0.2769 ×Min. Temp (â??) + 0.2397 × Max. Temp(â??) +0.0329 × RH (%) - 0.208 |
0.7508 | |
| (RF+T+RH)max | Yield (tha-1) =0.018×Rainfall (mm) + 0.018 × Min.Temp (â??) +0.095×Max.Temp (â??) -1.2525 |
0.1208 | |
| (RF+T+RH)max.T1T2 | Yield(tha-1) =-0.0285×Rainfall(mm)+14.6069 × T1(â??)+6.58×T2 (â??) + 0.6645 × RH (%) - 22.96 |
0.2135 |
| District Name | Model Name | Yield Model | R2 |
|---|---|---|---|
| Haridwar | NDVI(60) | Yield(tha-1) =5.97× NDVI60 + 0.01 × Rainfall(mm) + 0.1431 ×Min. Temp (â??) + 0.001 × Max. Temp (â??) + 0.0027× RH(%) - 0.1861 |
0.6981 |
| NDVI(90) | Yield (tha-1)= 4.65×NDVI90 + 0.02×Rainfall(mm)+0.059 ×Min. Temp (â??) - 0.0015 × Max. Temp(â??) -0.0047 × RH (%) + 0.611 |
0.7976 | |
| NDVI(max) | Yield (tha-1) = 3.77 × NDVImax - 0.0001× Rainfall (mm) - 0.0267 ×Min.Temp(â??)+0.1693 ×Max.Temp(â??)+0.019×RH(%)-3.83 |
0.8918 | |
| NDVI(max)T1T2 | Yield(tha-1) = 3.93 × NDVImax - 0.003 × Rainfall(mm) -0.5022×T1(â??)-22.53×T2(â??) + 0.0086 × RH(%)+22.068 |
0.8860 |

Figure 5. Relationship between observed and predicted yield for Allahabad (a)- NDVI (60)-Model, (b)- NDVI (90)-Model, (c)- (RF+T+RH) max-Model, (d)- NDVI (max)T1T2-Model.

Figure 6. Relationship between observed and predicted yield for Allahabad (a). (RF+T+RH)60-Model, (b). (RF+T+RH)90-Model, (c). (RF+T+RH) max –Model, (d). (RF+T+RH) max. T1T2Model.
Allahabad when rainfall, temperature, and relative humidity were considered at 60 days after sowing (DAS), while the highest value of R2 was obtained as 0.8919 when NDVI (max) model was considered. It shows that NDVI is a good indicator for the prediction of wheat yield for the district of Allahabad, while the performance of another model was within the permissible limit.
For the district of Haridwar the lowest value of R2 was found as 0.1119, when the NDVI parameter was not considered. In another way, when the NDVI parameter was considered to compare between observed and predicted values, the R2 value had the highest as 0.8919. This indicated that NDVI was the most valuable parameter to compare the between observed and predicted yields. It is as shown as in Figures 7 and 8, while other parameters performed within permissible limits. Also, a similar pattern was found in the district of Ludhiana, (Figures 9 and 10) show that when NDVI parameter was not considered it had the lowest value of R2 as 0.1113. When the NDVI parameter was considered, it had the highest value of 0.8335. So, all these models showed NDVI was the most valuable parameter.

Figure 7. Relationship between observed and predicted yield for Haridwar (a). NDVI (60)-Model, (b). NDVI (90)-Model, (c). NDVI(max)-Model, (d). NDVI(max)T1T2-Model.

Figure 8. Relationship between observed and predicted yield for Haridwar (a). (RF+T+RH)60-Model, (b). (RF+T+RH)90-Model, (c). (RF+T+RH) max –Model, (d). (RF+T+RH) max. T1T2Model.
Need for consideration of NDVI and other variables in crop yield modelling
This is motivated by two aspects. One of the popular models to forecast wheat yield is listed on one of the U.S. websites. (http://www.nue.okstate. edu/Yield_Potential.htm) This model is also known as the INSEY model. The model uses eqs. (2) and (3) to compute the grain yield of wheat.
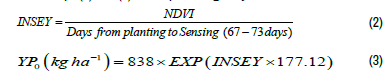
The results based on equation 2 and 3 are shown in Figure 11. For Allahabad, this model did fairly well. However, for Ludhiana, the performance was not that good. Similarly, for Haridwar, the scatter was evident along two lines. From Figure 11, it is apparent that NDVI worked well for certain

Figure 9. Relationship between observed and predicted yield for Ludhiana (a). NDVI (60)-Model, (b). NDVI (90)-Model, (c). NDVI(max)-Model, (d). NDVI(max)T1T2-Model.

Figure 10. Relationship between observed and predicted yields for Ludhiana (a). (RF+T+RH)60-Model, (b). (RF+T+RH)90- Model, (c). (RF+T+RH) max –Model, (d). (RF+T+RH) max. T1T2Model.
situations. Thus, the use of strategies to strengthen NDVI based models with additional input was justified. The second aspect dealt with the plot between NDVI and some of the meteorological variables. Figures 12-14 represent some of the typical variations. It can be seen from this figure that the correlation of NDVI with the meteorological variables was not so strong that it can be used as the only independent variable to model crop yield. Thus, Figures 11-14 coupled with the performance evaluation of various strategies, as indicated in Tables 1-6, also support the use of NDVI as well as meteorological variables.
Performance evaluation of INSEY model
Linkage between NDVI and other meteorological variables
From Figure 12-14, it is a apparent that NDVI did not have a strong correlation either with precipitation or temperature. Thus, its use with precipitation and temperature was justified.

Figure 11. Comparison between observed and predicted yields with INSEY model for (a). Allahabad (b). Haridwar (c). Ludhiana.

Figure 12. (a). Relationship between average temperature versus NDVI (max) and (b). Rainfall versus NDVI (max) for Allahabad.

Figure 13. (a). Relationship between average temperature versus NDVI (max) and (b). Rainfall versus NDVI (max) for Haridwar.
Effect of time duration on crop yield modelling
The model developed with NDVI and without NDVI for three districts at 60 days, 90 days, and at maturity showed that the R2 value increased with time duration. This indicated that the model developed at maturity gave better results than by mid-season crop forecasting models.
Performance evaluation of models with and without NDVI
The performance of regression equations in Tables 1 to 6 for the district

Figure 14. (a) Relationship between average temperature versus NDVI (max) and (b) Rainfall versus NDVI (max) for Ludhiana.
| District Name | Model Name | Yield Model | R2 |
|---|---|---|---|
| Haridwar | (RF+T+RH)60 | Yield (tha-1) = - 0.0649 × Rainfall (mm)+ 0.0759 ×Min.Temp(â??) + 0.05166 × Max.Temp(â??) + 0.0072 × RH (%) + 0.6360 |
0.1239 |
| (RF+T+RH)90 | Yield (tha-1) = - 0.022 × Rainfall (mm) + 0.211× Min.Temp (â??) -0.033 × Max.Temp(â??) - 0.0024 × RH (%) +1.565 |
0.1996 | |
| (RF+T+RH)max | Yield (tha-1) = - 0.00026 × Rainfall (mm)+ 0.1507 × Min.Temp (â??) + 0.1815 × Max.Temp (â??) +0.028 × RH (%) - 4.58 |
0.2565 | |
| (RF+T+RH)max.T1T2 | Yield(tha-1) = - 0.0059 × Rainfall (mm) - 0.7064 × T1 (â??) -35.78 × T2 (â??) + 0.012 × RH (%) + 36.76 |
0.1118 |
| District Name | Model Name | Yield Model | R2 |
|---|---|---|---|
| Ludhiana | NDVI(60) | Yield (tha-1) = 7.91 × NDVI 60 -0.0843 × Rainfall (mm) - 0.312 Min.Temp(â??) + 0.390 × Max.Temp (â??) + 0.033 × RH (%) - 5.32 |
0.6855 |
| NDVI(90) | Yield (tha-1) =6.19 × NDVI 90 -0.10×Rainfall (mm) - 0.36 × Min.Temp (â??) + 0.34 × Max.Temp(â??) + 0.035 × RH(%) - 4.51 |
0.7893 | |
| NDVI(max) | Yield(tha-1) =4.97×NDVI max-0.008×Rainfall(mm) - 0.025 × Min.Temp(â??)+0.054 × Max.Temp(â??)+0.013 × RH(%)-0.1108 |
0.7864 | |
| NDVI(max)T1T2 | Yield(tha-1) = 5.20×NDVI max-0.01×Rainfall(mm)-0.32 × T1 (â??) -11.02×T2 (â??) + 0.009 × RH(%) + 11.43 |
0.8335 |
of Allahabad, Haridwar, and Ludhiana are summarised in Table 7. From the range of R2 values indicated in Table 7, it was apparent that the consideration of only meteorological variables was not adequate to model wheat crop yield. Thus, for better forecasts, the use of NDVI as well as meteorological variables was more useful.
Use of T1 and T2 in crop yield modelling
Bastiaanssen GMW [39] proposed a wheat yield model and proposed the use of two temperature indicators T1 and T2. In the regressions models, the use of these temperature indicators was also done via strategies D and H. For the Ludhiana district, Table 6 indicated better R2 with the use of T1 and T2. However, Tables 2 and 4 showed a similar performance even without the use of T1 and T2. It must be noted that some other factors may also affect crop yield like weed control, pest management, technology adopted during harvest
| District Name | Model Name | Yield Model | R2 |
|---|---|---|---|
| Ludhiana | (RF+T+RH)60 | Yield(tha-1) = 0.08 × Rainfall (mm) + 0.03 × Min.Temp(â??) -0.067 × Max.Temp (â??) - 0.021 × RH (%) + 6.83 |
0.1114 |
| (RF+T+RH)90 | Yield (tha-1) = - 0.011×Rainfall (mm) - 0.1517 ×Min.Temp (â??) + 0.0042 × Max.Temp(â??) - 0.0196×RH (%) + 6.93 |
0.2042 | |
| (RF+T+RH)max | Yield (tha-1) = 0.01 × Rainfall (mm) - 0.1622 ×Min.Temp(â??) -0.049×Max.Temp (â??) - 0.024 × RH (%) + 8.47 |
0.2159 | |
| (RF+T+RH)max.T1T2 | Yield(tha-1) = 0.02 × Rainfall (mm) + 0.39 × T1 (â??)+34.54 ×T2 - 0.02 × RH (%) - 28.00 |
0.2550 |
| District | With NDVI(R2) | Without NDVI(R2) |
|---|---|---|
| Allahabad | (81.75-91.83)% | (12.08-75.08)% |
| Haridwar | (69.81-88.6)% | (11.18-25.65)% |
| Ludhiana | (65.55-83.35)% | (11.14-25.50)% |
However, in the present study, whatever data is available has been utilized. The use of additional variables may lead to better models. However, the use of less number of variables is always desirable. It is further noted that only the maximum value of NDVI during the period of calibration had been used. If at any location, only NDVI based crop yield model was giving an acceptable performance, one should prefer that. The use of either the maximum value of NDVI or the sum of NDVI values may be explored further. However, the message which is emerges from this work is that there could be situations where NDVI based models need to be strengthened. The weights associated with other variables like rainfall and temperature are not only smaller in magnitude but also change their sign, indicating their lesser influence on the crop yield model. Despite this, the consideration of meteorological variables helped in improving the performance of NDVI based models. Another aspect that is worthy of consideration is that consideration of three districts in different agro-climatic zones may provide a better insight into the likely impact of climate changes which are evident in different ranges of temperature and precipitation values. Since the linkage between NDVI and agro meteorological variables is not obvious and the models based on only meteorological variables are not good except Allahabad, other approaches need to be explored to assess the impact of climate change on wheat yield forecasting [40-46].
The present study deals with several statistical regression models of the Wheat in three different districts of India which lie in different agro-climatic zones. Based on this work, the following can be inferred.
• Early season forecasts of wheat yield are possible in the studied regions and indicate the adaptation of a similar approach to develop forecasting models elsewhere in other agro-climatic zones.
• All regression models between yield and other variables show better performance, as the forecast time tends to crop maturity. The accuracy of developed models improves as one tends to consider a larger period for model calibration. It is possible to make forecasts even 60 days after the sowing of crop.
• NDVI based models may sometimes need to be strengthened using other meteorological variables. Only the maximum value of NDVI during a period of calibration of the model is considered. The weighting parameter associated with NDVI terms is larger when the time of calibration is small. The use of other temperature indicators, as proposed in the literature, has shown only marginal improvement. This improvement is marginal as the major contribution to the yield stems from the NDVI term.
The research carried out in this study was supported jointly by the Ministry of Earth sciences, Govt. of India, and the Natural Environmental Research Council (NERC), UK. (Grant code MES-1023-CED), in the Newton Bhabha project. We also thank the department of economics and statistics, ministry of Agriculture, Govt. of India for providing yield data.
Authors has no any conflict of interests.
Google Scholar, Crossref, Indexed at
Google Scholar, Crossref, Indexed at
Google Scholar, Crossref, Indexed at
Google Scholar, Crossref, Indexed at
Irrigation & Drainage Systems Engineering received 835 citations as per Google Scholar report


